

We recently received an inquiry from one of our members about Business Development Company (“BDC”) Oxford Square Capital (OXSQ). It seems a tempting investment considering its huge 11.5% yield, its discounted price-to-book value (0.9x), and its very low market beta (0.2). However, before investing, investors need to be aware of several very important things, including the vast difference between its price and total return, the very strong relationship between OXSQ’s price-to-book value and credit spreads, and how big hedge funds, including Citadel and Millennium, are trading in and out of this name regularly. We conclude with some thoughts on how you might consider “playing” this very high yield opportunity.
About Oxford Square Capital, Yield: 11.5%

For starters, here what Oxford Square does, according to FactSet:
Oxford Square Capital Corp. a business development company, invests in middle-market companies located in the US with revenues of less than $200 million, enterprise values of less than $300 million, experienced management team, strong competitive positions and profitable cash flows. The fund focuses on companies operating in the fields of computer software & hardware, networking systems, semiconductors, semiconductor capital equipment, diversified technology, medical device technology, information technology infrastructure or services, internet, telecommunications & equipment and media. It provides financing in the form of senior secured loans, senior subordinated, junior subordinated debt, warrants and other equity instruments for growth, acquisitions, recapitalizations and working capital requirements with an investment size ranging from $5 to $50 million in each portfolio company.
And here is a look at its investment portfolio:

It’s nice to see OXSQ diversified across 61 investments including varying segments and industries, however, collectively, these investments are exposed to the same big risk. Specifically, these are higher yield loans subject to credit risk that will deteriorate if the exonomy slows, and this will be reflected in credit spreads. We’ll get into more detail on credit spreads momentarily, but first let’s consider the important difference between OXSQ’s price return and its total return.
Price Return Versus Total Return
Price return is simply the return generated by the price of OXSQ without considering distributions, whereas total return is price gains plus distributions. And as you can see in the following chart, the two are very different.

Also worth mentioning, even though this fund has a low beta near 0.2, it has experienced some ups and downs versus the S&P 500 as shown in the following chart (we’ll have more to say about these ups and downs later, particularly as they related to price discounts and premiums).

Credit Spreads
As we mentioned earlier, credit spread movements are a big risk factor for OXSQ. And as shown in the following charts, you can see that OXSQ’s price moves in the opposite direction of credit spreads.


Credit spreads are basically the different in interest rates on low risk loans (such as US treasuries) versus higher-risk high-yield investments (such as OXSQ’s investments). This is important because credit spreads are currents low, as you can see in the above charts. This is because we are in a “risk on” market environment, but as soon as risk returns in greater force then the market will shirt to “risk-off,” credit spreads will widen, and the value of OXSQ will fall.
Book Value versus Credit Spreads
This next chart shows the book value of OXSQ’s investments versus credit spreads, and the same general relationship exists (i.e. they move in oppositge directions).

OXSQ’s book value can fall for idiosyncratic reasons related to each individual investment on its books, but the bigger driver is macroeconomics. Specifically, when the economy starts to deteriorate, no one wants to hold riskier loans (such as the ones on OXSQ’s books), so the book value of these investments goes down.
Valuation: Price-to-Book Versus Credit Spreads:
These next charts gives a general overview of OXSQ’s historical valuation, as measured by price-to-book-value relative to credit spreads.


There are some important take aways from this chart, mainly (1): OXSQ’s price to book valuation moves up and down (the shares trade at discounts and premium depending on the timing), (2) These discounts and premiums are somewhat related to credit spreads, but (3) the discounts and premiums often seem to overreact to credit spreads (i.e. when investors get scared, they really get scared, and they put seemingly too much selling pressure on OXSQ. And the opposites seems true too: when investors are confident, they are really confident, and the premium on the shares gets larger than credit spreads suggest it should. Of course there are other factors at work here (for example, the idiosyncrasies related to each individual portfolio investments), but the largest driver of price in this credit book is credit spreads. Worth menitioning multiple large hedge funds are trading in and our of OXSQ on a somewhat regular basis.
Hedge Funds: Citadel and Millennium Like to Trade OXSQ
Interesting, the following tables show the somewhat frequent round trip trades of OXSQ by hedge funds Citadel and Millennium.


Perhaps, these funds are recognizing a trading opportunity here. For more perspective, there are multiple hedge funds and trading firms moving in and out of OXSQ completely recently.


Distribution Coverage:
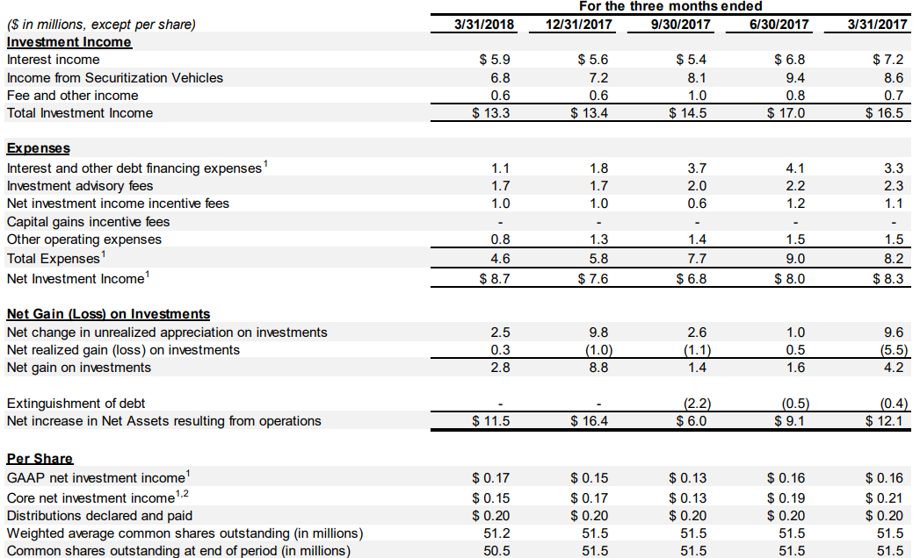
Another interesting thing to follow is OXSQ’s net interest income (“NII”) versus total returns. Management claims on its website and during its quarterly calls that is is focused on total return, not just net interest income. And this is a good thing because NII has recently not been enough to cover the large quarterly distributions to shareholders, as shown in the following table.
Worth noting, OXSQ has a history of raising and lowering its quarterly distributions to shareholders, as shown in the following chart.

Conclusion:
The yield of OXSQ is nice. Further, its lower correlation with the equity market is nice too. And from a price-to-book standpoint, it’s not terrible. Further still, we recognize performance has been strong on a total returns basis (depending on when you got in, and relative to OXSQ’s price ups and downs). However, we have no position in OXSQ, and we are not purchasing shares at this time. Instead, we are adding OXSQ to our watch list because its price does have a tendency to move significantly versus its net asset value; sometimes significantly more than it should, in our view, thereby creating attractive buying and selling opportunities.
We don’t believe OXSQ is a terrible investment at this point (again the price-to-book isn’t horrible, and credit spreads will probably stay low for a while). However, we view the biggest risk for OXSQ to be the potential for the market to enter a “risk-off” mode, which would cause credit spreads to widen significantly (they’re currently very low), and OXSQ’s price would decline sharply. And depending on the severity of such a sell-off, and relative to book value of the underlying assets, it could create an attractive buying opportunity. OXSQ’s price movements have a history of creating attractive buying opportunities.
