
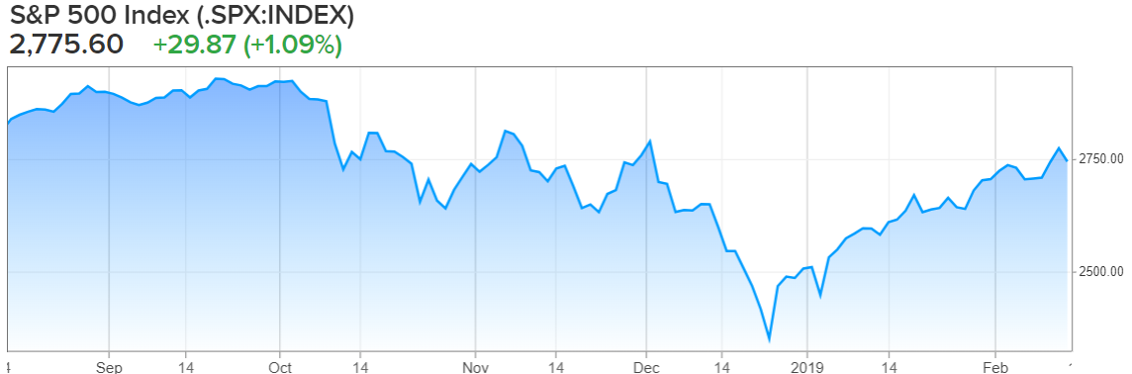
Stocks are off to their best start in 32 years. But as you can see in the chart, the strong start comes after an absolutely abysmal 4th quarter. This report reviews the current state of the rebound and opportunities from the perspective of high income closed-end funds. We conclude with investment ideas and advice.
What is a Closed-End Fund?
Closed-end funds, or CEFs, are often an income investors favorite because they often offer attractive high yields paid quarterly (and sometimes paid monthly). If you don’t know, according to Wikipedia, a CEF is:
“A collective investment model based on issuing a fixed number of shares which are not redeemable from the fund. Unlike open-end funds (e.g. ETFs), new shares in a closed-end fund are not created by managers to meet demand from investors. Instead, the shares can be purchased and sold only in the market…
The price per share is determined by the market and is usually different from the underlying value or net asset value (NAV) per share of the investments held by the fund. The price is said to be at a discount or premium to the NAV when it is below or above the NAV, respectively…
A premium might be caused by the market's confidence in the investment managers' ability or the underlying securities to produce above-market returns. A discount might reflect the charges to be deducted from the fund in future by the managers, uncertainty from high amounts of leverage, concerns related to liquidity or lack of investor confidence in the underlying securities.”
How to Pick a Good CEF…
To offer some ideas on how to pick a good CEF, we are featuring a guest write-up from popular income investor, “Yield Hunting.” He has graciously offered to share his weekly closed-end fund write-up (he calls it his “Power Rankings”), which includes a few of the quantitative things he screens for when searching for a good CEF. Here is his write-up, which discusses discounts to NAV, yield, z-score and a few additional important considerations:
YH Power Rankings Report | February 2019
For those that are familiar with the ESPN NFL Power Rankings, which rank the teams from 1-32 based on the opinions of several staff members, than this analysis will be familiar to you. Here we are ranking the entire CEF universe (~580 funds) using several factors and then applying a scoring methodology to it in order to rank the funds.
We will be doing this each month in order provide a starting point for analysis and due diligence.
What are we looking for here and how are we ranking?
Coverage: > 99%, UNII: > 0 Yield: Higher is better, Discount: Lower is better, Z-Score: < -1 (lower is cheaper)
In aggregate, we had only 15 funds meet the screen. Thus, we relaxed the UNII threshold (eliminating it) and the z-score screen to -0.5 to include more funds in our results.
That widened the field to some 36 funds.
10 Largest Discounts
But where the coverage is above 99% and the shares trade at a discount. Sorted by discount ascending.

10 Highest Yields
But where the coverage is above 99% and the shares trade at a discount. Sorted by descending yield.

10 Lowest Z-Scores
But where the coverage is above 99% and the shares trade at a discount. Sorted by ascending z-score.

10 Highest Overall Score
But where the coverage is above 99% and the shares trade at a discount. Sorted by descending overall score. The scoring takes into account the all four factors that we look at: discount, earnings coverage, total yield, and one-year z-score. By combining the four factors we are able to produce a total score.

Looking Deeper Into RMR Real Estate Income (NYSEMKT:RIF)
RMR Real Estate Income (RIF) is a relatively illiquid fund (35K daily shares traded) that invests primarily in real estate companies. These are so-called eREITs that dominate the REIT sector.
The investment policy:
Generally, in normal market conditions, we expect that: (I) at least 90% of the Fund’s managed assets will be invested in income producing securities issued by real estate companies, including common shares, preferred shares and debt; and (II) at least 75% of the Fund’s managed assets will be invested in securities issued by REITs, and (III) no more than 10% of the Fund’s managed assets will be invested in securities denominated in currencies other than the U.S. dollar or traded on a non-U.S. stock exchange.
The portfolio has 80% in stocks and 20% preferreds of REITs.
The top ten holdings are skewed towards the larger REITs in the sector with a large and diverse holdings base.

Characteristics:
· Total Net Assets: $339M
· Leverage: 31.2%
· Expense Ratio: 2.57% (including interest expense)
· Daily Trading Volume: 35,000
· Current Discount to NAV: 22.6%
· 52-Avg Discount to NAV: 19.75%
· Distribution Amount: $0.33 paid quarterly
· Distribution Yield: 7.42%
As we noted the fund invests in securities that pay a high level of current income on common stock. The second primary objective is to earn capital appreciation.
In September of 2017, the fund completed their rights offering issuing another 2.5 million shares at an average price of $17.75 raising another $45 million in common equity capital. At the same time, they raised their borrowing capacity to $88 million from $28 million through their revolving credit facility at BNP Paribas. The interest rate on that leverage is libor plus 95 bps.
About RMR:
RMR Advisors LLC, the adviser to RMR Real Estate Income Fund (RIF), was founded in 2002 and is focused on investing in real estate securities, including real estate investment trusts (REITs) and other dividend paying securities. As of September 30, 2018, RMR Advisors LLC had approximately $336 million of assets under management. RMR Advisors is a wholly owned subsidiary of The RMR Group LLC.
About The RMR Group LLC The RMR Group Inc. (Nasdaq: RMR) is a holding company and substantially all of its business is conducted by its majority-owned subsidiary, The RMR Group LLC. The RMR Group LLC is an alternative asset management company that was founded in 1986 to invest in real estate and manage real estate related businesses. RMR’s business primarily consists of providing management services to:
· Five publicly traded eREITs
· One publicly traded mREIT
· Three real estate operating companies
· One closed-end fund focused on investing in real estate securities
· Other private funds and accounts that invest in real estate securities
Commentary
When analyzing a fund that invests in equities, one of the first things one should do it compare the total return NAV performance against key benchmarks. This fund incepted back in late 2003 and has been around for more than 15 years. Below shows that cumulative performance.

Remember, RIF is a levered CEF, meaning that they are allowed to 'amplify' their returns. But you can see a simple Vanguard passive ETF, the (VNQ) did far better without the leverage. This tells me that either the addition of leverage on an already volatile asset class isn't helpful or the management team at RMR isn't strong at selecting securities (the active management).
Fees are another consideration. A pure equity CEF that charges 1% in management fees with no leverage, should trade at a sizeable discount. While this exercise is not exact, think of it this way. If you can get plain vanilla beta exposure through VNQ for 12 bps, you save nearly 1% per year. If total returns are expected to be around 6% per year, then you are giving up 16.6% of the return. All else equal, a $10 NAV fund with a $0.50 annual payout (5%) then should trade around $8.33 for a 16.6% discount in order to generate a distribution yield of 6%. That is a warranted discount and one investors should not expect to close.
We have mentioned this several times about some big name CEFs including the Boulder Growth and Income (BIF) which trades around a 16% discount. The fund owns some plain vanilla large-cap equity names including Berkshire Hathaway, JP Morgan, Cisco Systems, Yum Brands, Caterpillar, and Wells Fargo, amounting to over 58% of the total portfolio. It would be very easy for an individual investor to replicate that portfolio themselves and avoid the egregious 1.28% management fee.
Given these aspects, we do not think the fund is investable even at these levels. Nor do we think BIF is a good investment.
You may be asking why we analyzed a fund we did not like. The exercise was on purpose as RIF was the top scoring fund, from a quantitative perspective. However, when we delve into the fundamentals, the fund is a dog. This is why investors should focus on both fundamentals and the quantitative aspects.
Yield Hunting offers some very good perspective on a few things to look for in a closed-end fund, but also concludes by reminding us that the quantitative results alone are not enough; rather some human interaction is also required. We agree, and we’ll get into a variety of additional CEF ideas in a moment. But first, for some perspective on the 2019 rally so far, here is a look at some recent performance of broad market sector performance (remember, there are many sector and/or style specific types of CEFs, which we will get more into in a moment.
Sector Performance:

High-Yield Sector CEFs To Consider:
REITS: You’ll notice (in the chart above) that Real Estate Investment Trusts (“REITs”) offer the highest yield, and are the best performing sector over the last 1-year. And from a contrarian perspective, that’s arguably another reason why investors may NOT want to invest in the REIT closed-end fund that Yield Hunting discussed, RMR Real Estate Income Fund (RIF) (i.e. buy low, sell high!). And with regards to the current state of the 2019 rebound, REITs are often considered a “risk off” asset class, meaning they perform well when the market is fearful (because those big steady dividends deliver some safety and stability). For example, REITs also have relatively low “beta” market exposure (as shown in the chart above).
However, given where we are in the rebound so far (i.e. stocks are up big this year, but they still have not made up all the ground they lost in the fourth quarter) now may NOT be the best time to go chasing after the entire REIT sector through a CEF. At this time, we prefer select individual REITs, such as Omega Healthcare Investors (OHI) which we just wrote about in more detail here.
Technology and Consumer Discretionary: We’re lumping these two sectors together because they tend to be higher volatility “risk on” sectors, meaning they do better when the market is doing well (for example, they have similar betas). They’re both up significantly so far this year, but they have not made up the ground they lost in the fourth quarter.
And if you are looking for an attractive way to play these two “risk on” sectors, consider the following CEF…
Adam’s Diversified Equity Fund (ADX): Not only is this CEF heavy into technology and consumer discretionary stocks, but it offers a very big yield of at least 6% every year (last year it paid over 9%). And this particular CEF has been around and paying dividends for over 80 years (note: it pays three smaller dividends in the first three quarters of every year, followed by a big year-end Q4 dividend every year). It also trades at an attractive discount to its NAV, it uses zero leverage, it has a very low management fee for a CEF, a solid management team, and we own ADX in our Blue Harbinger Income Equity portfolio. You can view more details about ADX from Morningstar (such as the metrics we described above, and more, including top holdings) here.
Energy: Another high income CEF that scored well in Yield Hunting’s quantitative screener above is the Adam’s Natural Resources Fund (PEO). This CEF has a lot of exposure to the energy sector, and as you can see in our earlier table, energy has been one of the worst performers over the last year (even though it’s been one of the best so far this year). We have actually written about PEO a couple times recently, and believe it remains an attractive high-income CEF to consider. You can access our previous PEO write-up here, and you can see a variety of relevant metrics via Morningstar (such as big yield, discount to NAV, low management fee, and top holdings) here.
Healthcare: Also from a contrarian (and slightly lower beta) standpoint, healthcare sector CEFs are worth considering. Healthcare has been a weaker performer year-to-date (see our earlier table), and it’s a good way to bring in some steady (quarterly or monthly) income payments while gaining exposure to a sector with long-term demographics on its side (healthcare needs and demands continue to grow—a trend not likely to stop). For example, we like and own the…
Tekla Healthcare Opportunities (THQ) CEF which currently pays income monthly, offers a 7.6% yield, trades at a relatively attractive discount to its NAV, and has top holdings including Johnson & Johnson (JNJ), United Health Group (UNH), Pfizer (PFE) and Gilead (GILD) You can read more about THQ on Morningstar here. And if the yield on THQ is not enough for you then consider the Tekla World Healthcare CEF (THW) which offers a 10.9% yield, and many of the other attractive characteristics of THQ, plus more non-US exposure. The Morningstar data for THW is available here.
Conclusion:
So where are we in the current rebound that has been occurring since the market bottomed on December 24th? We’ve made up A LOT of ground, since the bottom, but we’ve still got a lot more room to run before we reach the highs we were hitting just over 4 months ago (see the chart at the start of this article).
As we always say, no one (and that means absolutely no one) knows where the market is going tomorrow, next week, or next month. However, we do know that the economy is strong, and over the long-term the market is likely going much much higher. The “trick” to investing is to know your goals, assemble a portfolio that meets your needs (for example do you need income now from your investments, or are you focused only on long-term growth), and then stick to your plan. Don’t let market volatility, gyrations and media fear-mongering trip you up.
If you are an income-focused investor, owning a few CEF’s can be a good idea. They can provide diversification, attractive buying opportunities, and very satisfying income payments—often paid monthly. For example, we like (and own) several high-income CEFs, as described in this article.