You many not notice it with all three of the major indexes downs so far today, but we are seeing some positive signals from the highest growth stocks and from commodities.
BH THINKER: The Worst First Half for Stocks in 50 Years
10-Day Market Reversal
Lead of Value Over Growth
10-Year Treasury vs Growth Stocks
As you can see in the following chart, there has been a high correlation between high-growth stocks (as measured by the Ark Innovation ETF (ARKK)) and the 10-year treasury rate. More so than for the S&P 500 or the Dow.
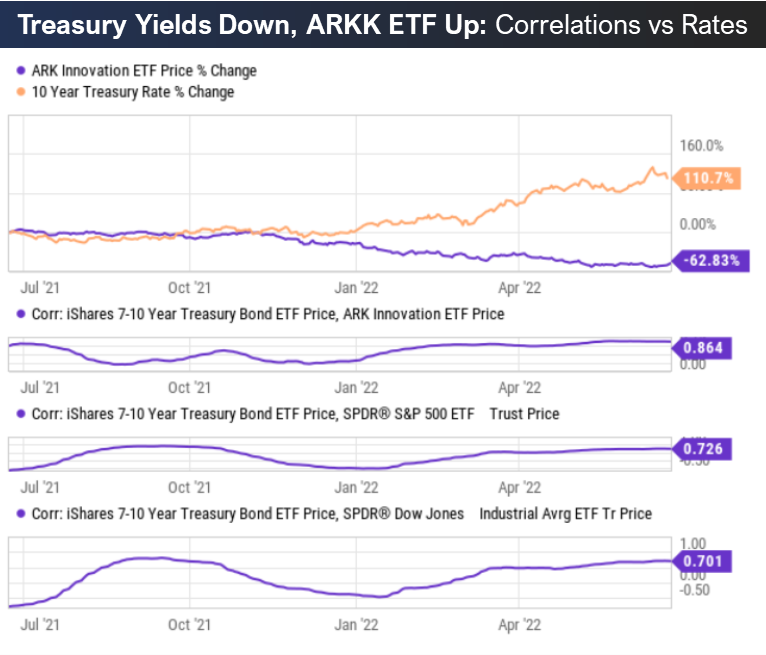
The reason is because as the fed raises rates to fight inflation, they slow down the economy as a side affect, and the most growth-oriented names are the most negatively affected.
Considering we just had the largest drop in 10-year treasury rates this week since Covid, it was off-to-the-races for ARKK and high-growth stocks in general.
Top Sales Growth: 20 Worst Performers
The Big-Dividend Report
Chip Stocks: Price-to-Sales Ratios Decline
Looming Recession?
China "Tech Crackdown" Reversing
40 Big-Dividend BDC's: Price-to-Book Values
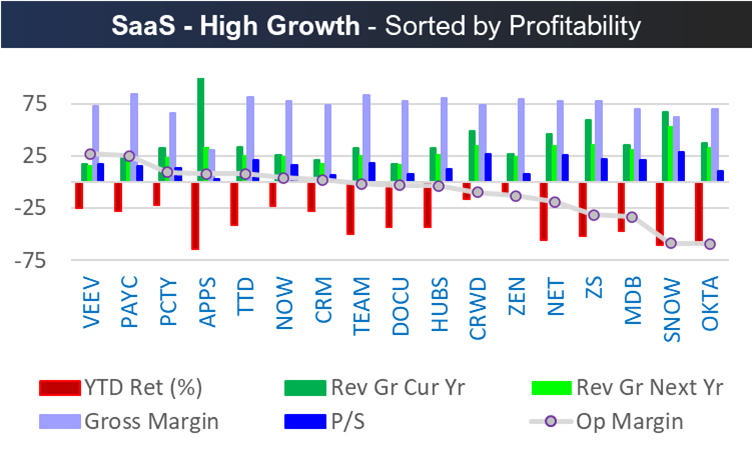
High Growth Stocks - with Room to Run
These are potentially “rocket fuel” stocks in the coming months, IF inflation has peaked and the Fed becomes less hawkish. It also doesn’t hurt that China has decided to lighten up on its crack down on tech. The “% of 52-Week Price Range” shows how much more upside these stocks could have relatively to where they sit between their 52-week highs and lows.
The Tech Bubble Took Over 2.5 Years to Fully Burst
The Tech Bubble (QQQ) peaked on 3/10/2000 and it took more than 2.5 years for it to fully burst. We are in a different environment today (i.e. low rates rising, massive revenue also rising for top growth stocks), but here is sector performance when the bubble burst (the first year and peak to bottom). Cathie Wood’s ARKK ETF peaked in June 2021 and the Nasdaq (QQQ) peaked in late 2021.