
If you are truly a long-term income-focused investor, the closed-end fund (“CEF”) we review in this report is attractive for a variety of reasons. For starters, it offers a 6.9% yield and it trades at a compelling discount to its net asset value (“NAV”). However, we particularly appreciate the fund’s flexible, low-turnover and prudently-concentrated long-term strategy (not to mention its very long-term track record of success). After reviewing these qualities, plus multiple critical risk factors, we conclude with our opinion on why this fund remains such an extremely attractive long-term opportunity for income-focused investors.

Central Securities Corp (CET), Yield: 6.9%
CET is a closed-end fund that was first organized on October 1, 1929. It pays a big annual dividend (its current yield is 6.9%), however the investment objective is long-term growth of capital (and income received from investments is a secondary consideration). According to CET, the investment strategy is:
“to own companies that we believe will generate superior returns when compared with the broad market and preserve the Corporation's capital in an inflationary environment. A guiding principle is the consideration of equity securities as units of ownership of a business and the purchase of them when the price appears to be low in relation to the value of the total enterprise.”
CET is not restricted as to the types of securities (e.g., equity, fixed income) in which it invests (although it owns mostly stocks). And the fund may invest in securities of issuers with any market capitalization. The fund is also not not required to be fully invested in securities and generally maintains a portion of its total assets in cash and cash equivalents.
The fund is concentrated, and held only 28 positions at the end of 2022 (down from 34 at the end of 2021). For reference, here is a look at the fund’s recent top holdings.

You’ll notice in the above table that its largest position (privately held insurance company, “The Plymouth Rock Company”) makes up an enormous 22.8% of the net assets (more on this important investment later). And you’ll also see the date each position was first acquired, thereby giving you an indication of the fund’s long-term investment approach. For example, the holdings turnover ratio was in the single digits in 2022 (a good thing for long-term investors because it reduces trading costs and trading risks, and shows that the fund really is a long-term investor).
You’ll also notice (in the chart below), CET is diversified across market sectors.

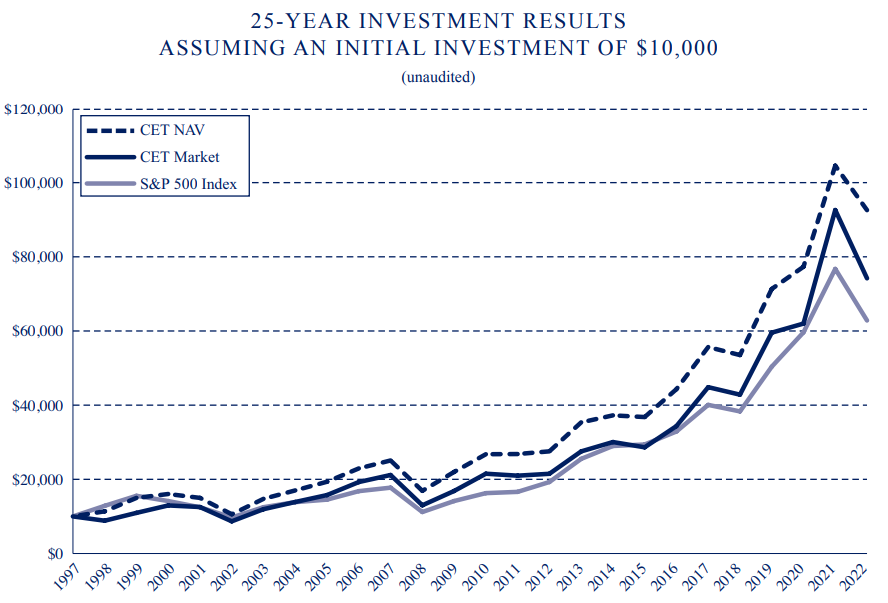
Further still, CET has a strong 25-year track record as compared to the S&500.
Discounted Price Versus NAV:
Because CET operates as a closed-end fund, it can trade at wide discounts or premium to its net assets value. Currently (and for over two decades) it has traded at a significant discount to NAV (as you can see in the chart below).
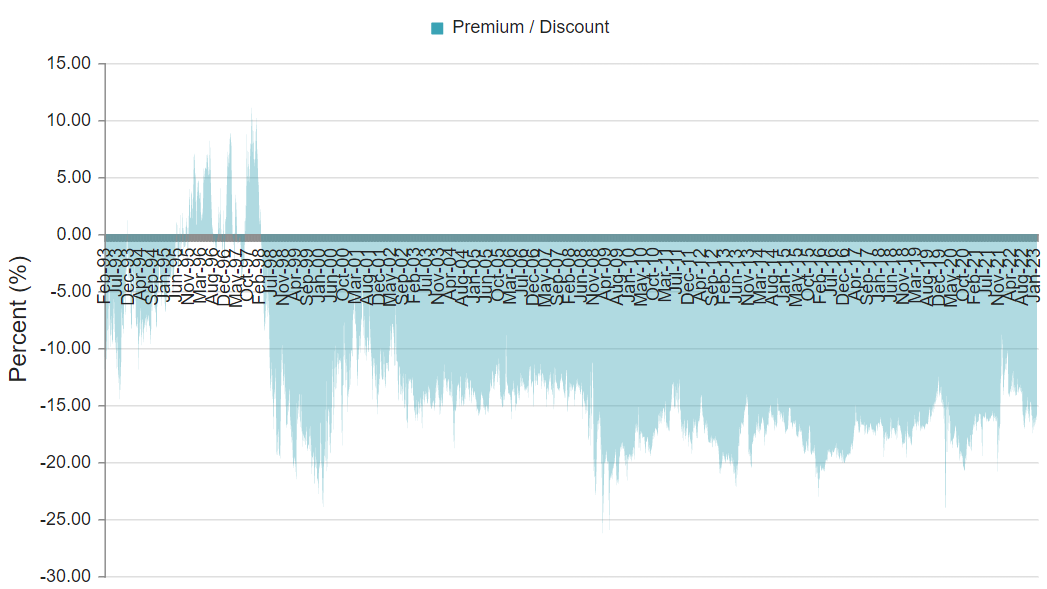
This large discount is a very good thing because it means you get to buy a share of all the underlying holdings (i.e. the 28 stocks) at a discounted price versus their NAV. The large discount is also good for the dividend reinvestment program (we will cover later in this report). We also talk more about this discount in the “risks” section of this report. Large discounts are unique to CEFs (they generally cannot happen in mutual funds and exchange traded funds) and we greatly prefer to buy attractive things at a discount.
The Plymouth Rock Company:
As noted earlier, the largest holding in CET is the Plymouth Rock Company. This is a large private insurance company. Specifically, Plymouth Rock underwrites and services $1.7 billion in automobile and homeowner’s insurance premiums in the Northeast US. Founded in 1982, it has grown both organically and by acquisition. CET is the second largest owner of Plymouth Rock, and it has owned its position since 1982 (as noted in our earlier table).
Plymouth Rock is a good example of the flexibility that CEFs have that other mutual funds and ETFs do NOT have. Specifically, CET can own Plymouth Rock because CET has control of fund inflows and outflows (i.e. it is “closed-end”) whereas other mutual funds and ETFs couldn’t own such a large investment because it is illiquid.
Also important to note, CET carries Plymouth Rock on its books at a large discount to what it is actually worth. Specifically, they record it at a 25% to 40% discount to what they believe its really worth to account for the illiquidity. For example, here is what CET had to say about Plymouth Rock’s valuation in its 2022 year-end annual report.
Management assists the Board of Directors in the determination of fair value of Plymouth Rock. In valuing the Plymouth Rock Level 3 investment as of December 31, 2022, management considered Plymouth Rock’s financial condition and results of operations, the insurance industry outlook, and any transactions in Plymouth Rock’s shares. Management used significant unobservable inputs to develop a range of values for the investment. It used a comparable company approach that utilized the following valuation multiples from selected publicly traded companies: price-to-book value (range: 1.0–2.3; average: 1.7); price-to-historical earnings (range: 12.4– 33.9; average: 20.7); and price-to-forward earnings estimates (range: 14.5–34.9; average: 22.8). Management also used Plymouth Rock’s book value and a discounted cash flow model based on a forecasted return on equity of approximately 12% and a cost of capital of approximately 12%. The average of these values was then discounted for lack of marketability and control of the Plymouth Rock shares. Management considered a discount range of 25% to 40%, a range management believes market participants would apply. An independent valuation of Plymouth Rock’s shares obtained by Plymouth Rock was also considered. Management presented and discussed the above information with the Corporation’s directors, who determined the value for the investment.
The good thing about the discount applied to Plymouth Rock is that CET (and the shareholders) could realize a very large gain if there ever was a Plymouth Rock liquidation event (something we discuss further in the risks section of this report).
The Plymouth Group is expected to release its 2022 Annual Report in March/April. But for more color:
According to A.M. Best, the insurance industry’s premier independent rating service, the Plymouth Rock Group of Companies is financially very strong. A.M. Best has assigned an A- ("Excellent") rating to each underwriting and managed insurance company in the group.
Overall, we view CET’s Plymouth Rock investment as concentrated, but conservatively valued. It has been very successful over the years (CET cost basis is $700,000 and its currently valued on the books conservatively at $258.7 million), and will likely provide additional upside (especially in a liquidation event) in the years ahead (and that’s in addition to the attractive dividends Plymouth Rock pays).
Dividend Track Record:
One important thing to note about CET’s dividend, is that it is big, but lumpy and paid only twice per year. According to CET:
It has been the Corporation's policy to make two payments to holders of Common Stock each year. A smaller cash payment is generally made at mid-year, and a distribution consisting primarily of realized capital gains is made at year-end when available. Stockholders have been given the opportunity of receiving the year-end distribution either in additional shares of stock or in cash, at their election.
You can see (in the table below) the historical dividends CET has paid, and they have been impressive.
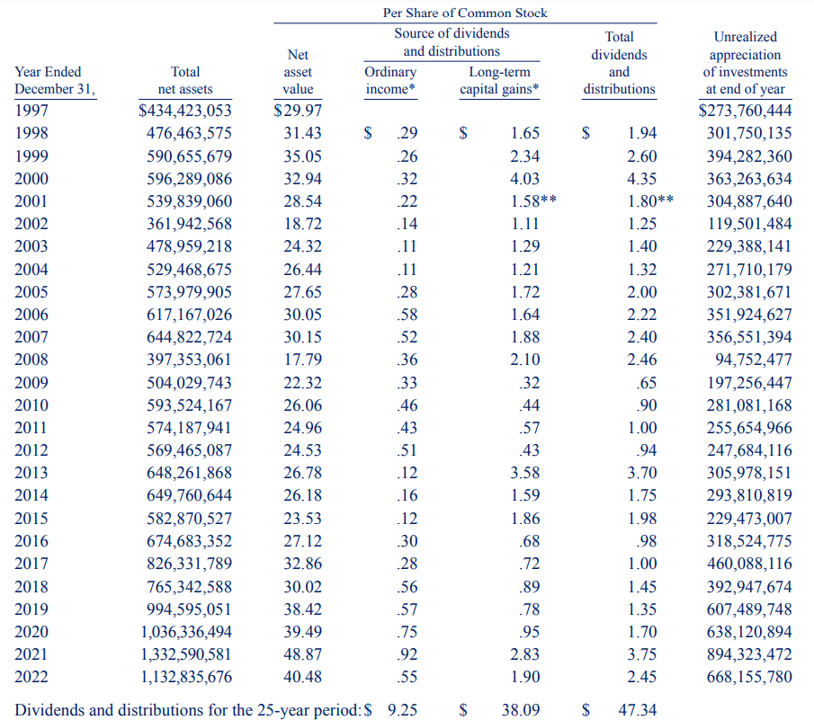
You’ll notice in the above table CET funds the dividend with ordinary income received from the underlying holdings, as well as long-term (not short-term) capital gains on those holdings. This is important from a tax standpoint because in recent years, 100% of dividends taxable as ordinary income are considered “Qualified Dividends” (i.e. they’re taxed to you at a lower rate, if you own CET in a taxable account). And then of course long-term capital gains are also taxed at the lower long-term capital gains rates (also a good thing—especially if you are in a higher tax bracket).
Also noteworthy, you can see how much unrealized long-term gains the fund has (in the table above). This is important because that represents a source for future distributions (the long-term capital gains part). Since 1997, the fund has only had to support the dividend with a return of capital one time (in 2001 following the losses related to the tech bubble bursting). And the fund continues to have a lot of unrealized capital gains today (see the last column in the above table).
Dividend Reinvestment and Share Repurchase:
Also important, if you choose to automatically reinvest the dividends, you get more shares at a discounted price (because CET trades at a discount to NAV). For reference, for the distribution paid in December, 46% of shareholders elected to receive the dividend in stock (at a price of $35.36 per share).
During 2022, the CET also purchased 79,449 shares of its common stock at an average price of $34.36 per share. From time to time, CET may purchase its common stock in such amounts and at such prices as the Board of Directors deems advisable in the best interests of stockholders. Purchases may be made in the open market or in private transactions directly with stockholders
Risks:
Of course, there are risks to investing in CET that should be considered.
Expense Ratio: CET’s annual total expense ratio was recently 0.50%. Some investors are turned off by this expense ratio (even though it is low for a CEF) because they think it detracts too much from net returns. However, after factoring in the large price discount to NAV (plus to you can reinvest dividends at a discount to NAV), the 0.50% expense ratio is more than offset. And again, this fund has a long history of delivering bottom line net of fee results that beat the S&P 500.
Perpetual Discount to NAV: Some investors believe the discount to NAV is only worthwhile if it shrinks (or changes to a premium) after your buy the shares. While this would be nice, it’s still very attractive to buy at a discount (even if it never goes away) because you’re getting access to the income and growth of the underlying holdings at a discounted price (as explained above). However, it’s also important to note that the discount could also get significantly bigger (even though historically it has remained fairly consistent, as you can see in our earlier price discount chart).
Management Change: Some investors are concerned by the recent management change, as noted in the most recent annual report:
“After managing the Corporation since 1973, Wilmot H. Kidd stepped down as Chief Executive Officer effective December 31, 2021. Central Securities is now managed by John C. Hill, Chief Executive Officer, who joined the Corporation in 2016. Mr. Hill is assisted by Andrew J. O'Neill, Vice President, who joined the Corporation in 2009. Wilmot Kidd continues to serve the Corporation as Chairman of the Board.”
However, the fund strategy remains intact, and John Hill has now been successfully working with the firm since 2016.
Concentration Risk: We like the lower number of holdings (recently 28) because it shows the management team’s conviction. However, the very large position in Plymouth Rock could create large losses if something negative were to happen to Plymouth Rock.
Private Investment: Plymouth Rock is a private company, as as such its valuation is estimated (because there is no public stock price—Plymouth is not traded publicly). Also noteworthy, Plymouth Rock has a dual share class, whereby the majority of the voting shares are closely held (i.e. CET and other shareholders cannot prevent Plymouth from making decisions that may not be in their best interest).
Plymouth Liquidation Event: If Plymouth were to file for an initial public offering, that could impact the valuation of the shares and the performance of CET significantly. However, because CET adds a large discount to the value of Plymouth on its books, an IPO (for example) could result in very large gains for CET. Plymouth has grown quite large over the years, as described earlier in this report.
Conclusion:
Our bottom line is that we view Central Securities (CET) as a highly attractive long-term investment if you are an income-focused investor that can handle only two dividend (distribution) payments per year. We really like the fund’s strategy, despite the fact that the Plymouth Rock position creates significant risk (and reward) opportunities. If you are looking for an old-school strategy from a high-income fund that has successfully beat the S&P 500 for years (and is positioned to keep doing so) Central Securities is attractive and worth considering for a spot in your long-term income focused portfolio.