

UPDATE: Unbeknownst to many investors, PIMCO’s big-yield funds, PDI and PTY, are including a significant return of capital in their beloved big distributions (and it’s largely hidden through derivative swaps transactions). We reached out to PIMCO for comment, and found their replies (included in this report) concerning. These two big-yield PIMCO funds are simply not as good as many investors believe. Caveat emptor.
Phillips 66: Big Dividend, Attractive Long-Term Opportunity
Phillips 66 has recently under-performed the market because investors are too focused on the short-term crack spread impacts, rather than on the long-term growth into chemicals and midstream businesses. It is also a cash generation machine with a big growing dividend. Warren Buffett recently increased his ownership to nearly 15%. It announces earnings this Friday (7/29). We own it in our Income Equity strategy.
McDonald's (MCD) - Thesis
McDonalds (MCD)
Rating: Hold
Current Price: $117.60
Price Target: $128.57
Thesis:
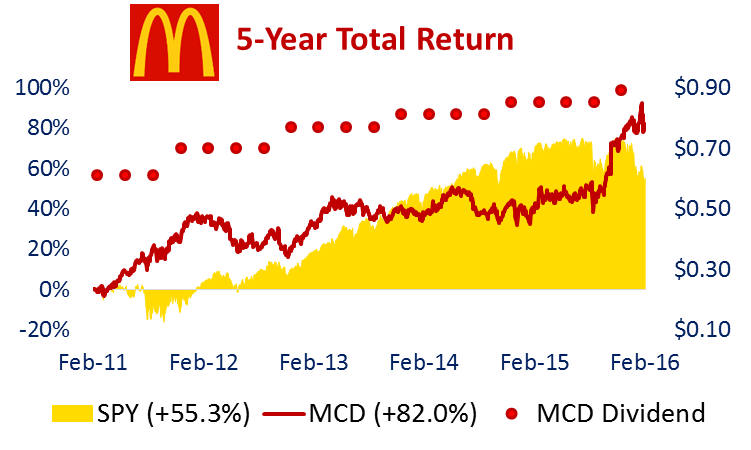
We believe McDonald’s stock is approaching its fair value as it has increased significantly over the last year, and we see less-dramatic growth opportunities going forward. We believe the stock continues to offer shareholders an attractive dividend yield and lower volatility than most stocks.
Weighing the Risks Ahead:
McDonald’s has outperformed an S&P 500 ETF (SPY) by 37% over the last year. However, the company faces a variety of risks moving forward. In the week’s Blue Harbinger Weekly we weigh the risks ahead for McDonald’s, and provide our view on why it might be time to reduce your exposure to this blue chip behemoth. We also provide an update on the one Blue Harbinger stock that announced earnings last week (it beat estimates by a very wide margin, and it continues to look great going forward!).
For starters, McDonald’s has undertaken a variety of initiatives over the last year that have improved the strength of the company and improved its stock price significantly. However, these initiatives are now baked into the stock price, and it is unlikely for McDonald’s to generate the same level of big gains over the next year. We have described these initiatives below.
- Chinese supplier issues: Part of the reason McDonald’s has been able to generate outsize returns over the last year is because the stock was starting from a very low level. McDonald’s stock was still in the dog house (pun intended) due to Chinese supplier issues that caused customers in the region to lose faith in the company. Since then China has been able to rebuild trust from its customers, and this has contributed to stock price gains. And while McDonald’s hopes to maintain the traction they’ve built in China, it is unlikely they’ll experience the same types of gains considering they are starting from a much higher price now (more on valuation later).
- New CEO: Steve Eastbrook became CEO in March 2015, and the stock immediately gained 6% on the news. We believe the stock price will continue to demand a premium with Steve as CEO, but it’s not likely to experience a similar 6% pop in 2016 because there isn’t likely to be another new CEO that is perceived to be even better.
For added color, shareholders were unhappy with the old CEO and welcomed Steve’s previous experience as the Chief Brand Officer of McDonald’s. Not unlike other large global employers, McDonald’s constantly faces brand challenges (for example quality of food perceptions), and thus far Steve has done an excellent job addressing the challenge. For example, he changed some recipes to improve the quality of ingredients (e.g. using real butter in egg McMuffins).
- All Day breakfast: McDonald’s made breakfast items available all day and this had a positive impact on sales. We believe this will continue to be a positive impact going forward, but it’s already baked into the price (more on valuation later).
- Turnaround Plan Completion: McDonald’s has been in a multi-year turnaround plan whereby capital expenditures have been heighted. Turnaround initiatives included significant expenses around reimaging a variety of restaurants. These turnaround plans are largely competed, and as a result capital expenditures are expected to be significantly lower going forward. McDonald’s has been transparent with the progress of the turnaround plans, and the gains from lower future expected capex is largely baked into the price already.
Valuation:
We are raising our McDonald’s price target to $128 per share compared to our previous target of $122.69. To arrive at this valuation we used a discounted cash flow model. Our model assumes approximately $5.1 billion of free cash flow in 2016, a 5.82% weighted average cost of capital and a conservative 1.5% growth rate. Our price target is approximately 9% higher than McDonald’s current market price, and this is not unattractive, especially considering its 3% dividend yield and lower volatility versus the rest of the market. However, this is a lower expected return compared to many other stocks, and McDonald’s faces a variety of risks.
Risk Factors:
- Already Near Fair Value: For starters, we believe McDonald’s is not nearly as undervalued as it was in our last valuation report on July 27, 2015. At that time the price was $97 per share, and we believed the stock had over 26% upside due mainly to the initiatives we described above. Now that McDonald’s has executed on many of those initiatives, we believe the stock has less upside going forward. Our valuation (above) assumed only a 1.5% growth rate for McDonald’s, but if that growth rate falls to only 1% then our price target would fall to only $115 per share, which is $2 lower than its current market price. For reference, McDonald’s global comparable sales grew by 1.5% in 2015 (source: fourth quarter earnings announcement).
- Unattractive Growth Prospects: With many major initiatives now in the past, McDonald’s future growth prospects seem far less attractive.
- Value Menu Initiatives: One potential source of growth is the company’s expansion of “value initiatives.” For example, McDonald’s recent “Two for Two” menu offers may drive traffic in the near term, but eventually the effects of the promotion may wear off, traffic may decrease, and McDonald’s may be left with reduced traffic spending at lower price points.
- REIT Spinoff: Another potential source of growth is the possibility of a REIT spinoff. There has been some talk among McDonald’s board as to unlocking shareholder value by spinning off the company’s real estate into a real estate investment trust (REIT). We believe this could unlock a one-time valuation increase for shareholders, but this seems unlikely based on recent news as we have written about here. Further, we don’t believe it offers as much stock price appreciation potential as the company has achieved over the last year.
- Changing Consumer Preferences: There is a constant and evolving risk that consumer preferences could shift away from McDonald’s and more towards, smaller, healthier, more socially responsible restaurants. We believe there is some truth and some falseness to this perception. It is true that consumer preferences change, and may shift away from McDonald’s. However, McDonald’s has very significant socially responsible initiatives underway to address customer concerns. More information is available on the Sustainability section of the company’s website. In our view, McDonald’s often receives a disproportionately large amount of negative media attention simply because it is so large that it has become an easy target for a variety of activists and causes.
- Currency Risks: The impacts of foreign currency exchange rates are largely out of McDonald’s control, and they have had a significantly negative impact on the company’s recent earnings. For example, McDonald’s consolidated revenues decreased 7% in 2015, but would have actually increased 3% if it were not for the strong US dollar. We believe any strong currency moves in the opposite directions could cause a jump in McDonald’s earnings. However, this is not a long-term strategy, and we don’t expect it to significantly improve earnings on a sustainable basis. And in fact, it could continue to move against McDonald’s in the future.
Conclusion:
We rate McDonald’s a hold with a price target of $128.57. We are not yet selling our MCD holdings, but we are not adding to our position either. We are currently reinvesting all McDonald’s dividend payments into other stocks. We still believe McDonald’s stock has price appreciation potential, but simply not as much as it had a year ago due to its recent strong rally. We recognize the stock offers an attractive dividend yield (over 3%) and lower volatility. We believe the stock is still attractive to income investors (we own it in our Income Equity portfolio), and we continue to hold it in our Disciplined Growth strategy as well because it offers some price appreciation potential and it adds important diversification to the strategy.
Automatic Data Processing (ADP) - Thesis
Automatic Data Processing (ADP) – Thesis
Rating: BUY
Current Price: $78.13
Price Target: $114
Thesis:
Automatic Data Processing (ADP) is an attractive stock to own. It’s a stable, highly profitable, human capital management (HCM) company with a large and growing dividend. Additionally, ADP is developing and growing its cloud-based HCM solution to meet customer needs and to keep ADP an attractive and relevant investment for years to come.
ADP is stable, highly profitable, and offers an attractive dividend.
If you’re not familiar, ADP provides a range of software and services to help companies recruit, staff, pay, manage and retain employees. And as the following chart shows, ADP’s revenues and profits are very large and fairly stable:

A big reason for the stability is the high customer retention rate. For example, ADP’s worldwide client revenue retention was 91.4% in fiscal 2015 (Annual Report, p.26). This steady stream of business helps reduce the company’s volatility, and it also helps the company pay a healthy dividend (i.e. ADP has an above average 2.5% dividend yield).
Additionally, ADP’s stable business generates lots of free cash flow so it can continue to increase the dividend as well as repurchase shares. The following chart shows ADP’s free cash flow over the last several years:

Specifically, in fiscal 2015 ADP paid dividends of $927.6 million and returned $1,557.2 million in cash through their share buyback program (ADP Annual Report, p.20). The company also has a track record of increasing the quarterly dividend for 40 consecutive years.
ADP is able to increase the amount of cash retuned to shareholders because it is growing at only a moderate pace. Sources of growth for ADP include economic growth (ADP generally grows as the economy grows), international growth (the company is working to expand outside the US), and rising interest rates (management estimates that a change in both short- and intermediate-term interest rates of 25 basis would result in approximately a $12 million impact to earnings from continuing operations) (Annual Report, p.33). However, ADP would not be returning any cash at all to shareholders if they had the same aggressive growth opportunities as some of their smaller competitors (more on this later).
Valuation:
A basic discounted free cash flow model suggest the market is expecting ADP to grow at an annual rate of about 4.4% (we divided fiscal 2015 FCF by the WACC [8.4%] minus the growth rate to back into the current share price). A 4.4% growth rate is not unrealistic given the company’s growth opportunities. And realistically, ADP will likely achieve a higher growth rate given its current trajectory. For example, analysts surveyed by Yahoo Finance expect earnings to grow at an annual rate of 10.4% over the next 5 years, and management has already provided guidance for 7-8% revenue growth in 2016 (ADP Earnings Release). For example, if ADP grows at 8% for the next five years, and then reverts to a lower 4% growth rate thereafter, the stock is worth $114 per share.
ADP’s Competition:
Like ADP, Paychex (PAYX) is an HCM company with large and fairly stable profits. And while Paychex market capitalization is smaller than ADP’s ($19B vs $39B), the following chart shows Paychex’s profit margin is higher:
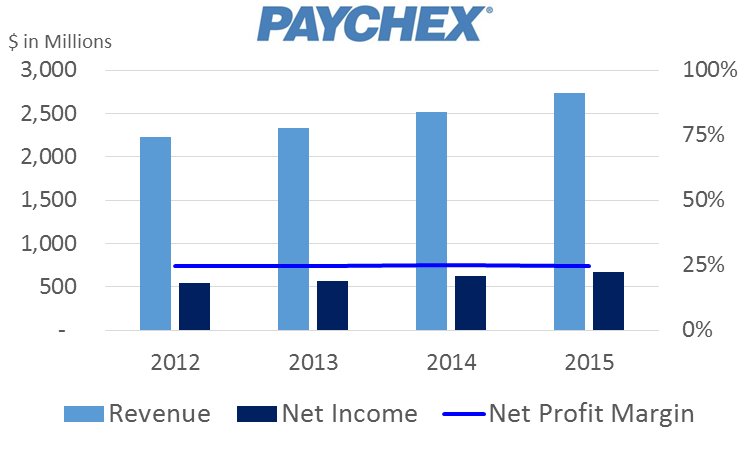
Like ADP, Paychex also generates an impressive stream of FCF that can be used to grow the business or return to shareholders (i.e. share repurchases and dividends).

For example, Paychex used it’s FCF to repurchase shares ($182.4 million in FY 2015) and pay dividends ($551.8 in FY 2015). And specifically, PAYX dividend payments amount to an impressive 3.2% dividend yield (significantly higher than ADP).
However, Paychex doesn’t have great organic growth opportunities, and they are reverting to inorganic growth instead. Inorganic is generally less profitable and less desirable than organic growth. Regardless, Paychex explains that it seeks inorganic “growth through strategic acquisitions” (GoogleFinance description). This is in contrast to ADP’s strategic goal to grow organically (one of ADP’s three strategic pillars is to “grow a complete suite of cloud-based HCM solutions, Annual Report, p.3). Paychex’ interest in strategic acquisitions may include aggressive growth cloud-based competitors Paycom (PAYC) and Ultimate Software (ULTI), but more on these companies later.
A basic discounted free cash flow model suggest the market is expecting PAYX to grow at an annual rate of about 4.9% (we divided fiscal 2015 FCF by the WACC [9.1%] minus the growth rate to back into the current share price). A 4.9% growth rate is not unrealistic given the company’s growth opportunities. Somewhat similar to ADP, Paychex growth opportunities include economic growth, aggressive sales initiatives, strategic acquisitions (Paychex, not ADP), and rising interest rates. And realistically, Paychex may achieve a higher growth rate given its current trajectory. For example, analysts surveyed by Yahoo Finance expect earnings to grow at a rate of 9.5% over the next 5 years, and management has already provided revenue and earnings growth guidance of 7-8% and 8-9%, respectively, for fiscal year 2016 (Q1’16 Earnings Release, p.3). However, we believe Paychex does not offer a risk/reward profile that is as attractive as ADP, and for this reason we do NOT own Paychex.
If you like more risk, ADP’s cloud competition may offer a more reward.
ADP and Paychex are experiencing increased HCM competition from cloud-based software companies such as Paycom (PAYC), Paylocity (PCTY) and Ultimate Software (ULTI). These cloud based companies offer solutions that are often better suited for smaller companies. Unlike ADP, the cloud-based software competitor solutions require no customization and are maintained in a single database for all HCM functions. This is particularly attractive to newer (and usually smaller) companies because they’re not bogged down by legacy systems and databases that they must maintain. However, for larger companies they cannot offer the same level of sophistication as ADP.
However, if you do like a higher risk/reward profile with no dividend, we do own Paylocity (PCTY) in our “Dividend Growth” strategy. Like Paycom and Ultimate Software, Paylocity is spending heavily to grow its business and will likely experience much higher volatility than steady ADP. Paylocity is not a good fit for our lower risk, higher dividend “Income Equity” strategy.
Conclusion:
We like ADP. It’s a steady growth business, it has significant price appreciation potential, and it offers an above average dividend. Also, we believe Human Capital Management is a steady growth industry that will benefit from a secular trend towards cloud based solutions. Additionally, because of the amount of client payroll cash on ADP’s books, a rising interest rate environment will be a helpful tailwind. Even though we believe some of ADP’s cloud competitors (for example Paylocity) offer higher risk-reward profiles, we also know they are not a good fit for “Income Equity” investors (they’re high risk and they don’t offer a dividend). ADP’s above average dividend is very safe, and the stock offers continued steady capital appreciation as well.
Caterpillar (CAT) - Thesis
Caterpillar (CAT) - Thesis
Rating: BUY
Current Price: $63.28
Price Target: $97 per share
Caterpillar (CAT) stock has fallen 43% since July of 2014, and it has a large 4.9% dividend yield. Additionally, the company has plenty of cash to continue its track record of dividend increases, and the stock also offers significant opportunity for capital appreciation. Despite dramatic declines in Caterpillar’s mining business, significant weakness in energy, a strong US dollar, and a declining outlook from management, CAT is still worth more than its current market price. Further, the company has ample financial wherewithal to weather intermediate-term challenges, and we believe Caterpillar will eventually revert to moderate growth making now an exceptional buying opportunity for long-term dividend investors as well as those seeking capital appreciation.
Why has Caterpillar’s stock price declined?
CAT’s stock price has declined because of sharp declines in revenues and future revenue forecasts. Specifically, CAT management expects total sales and revenues for 2015 to be $48 billion. This is down from $55 billion in 2014 and $66 billion in 2012. Further, management expects sales and revenues to decline another 5% in 2016.
The following table estimates the breakdown of the full-year 2015 $48 billion guidance from management based on trending sales volumes across business segments and regions. For reference, we’ve also included 2014 actuals.


As the above table shows, “Energy and Transportation” and “Construction Industries” are the two largest business segments (by revenue) for CAT. However, as recently as 2012, “Resource Industries” contributed over $21 billion in annual sales and revenues. For further context, the following tables show the increase/decrease (sales in dollars) for each business segment and region since 2012.
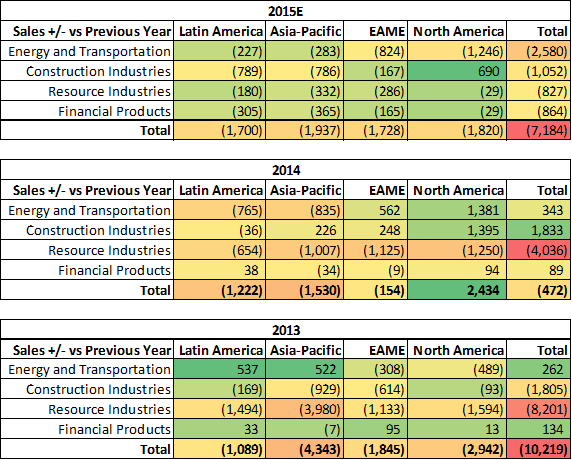
The table shows the dramatic decline in “Resource Industries” since 2012. This is the segment of CAT’s business that builds and supports machinery for the mining industry. The mining industry has been decimated in recent years as demand and prices have significantly declined. For example, the SPDR S&P Metals and Mining ETF (XME) has declined over 70% in the last five years.
Caterpillar’s “Energy and Transportation” business segment has also declined in 2015 and is expected to decline further in 2016. According to the company’s third quarter earnings release: “Energy & Transportation’s sales are expected to be down 5 to 10 percent [in 2016] as a result of continuing weakness in oil and gas coupled with a weaker order backlog than in 2015.” For reference, Energy & Transportation supports customers in oil & gas, power generation, marine, rail and industrial applications.
In addition to challenges across business segments, CAT has also been negatively impacted by the strong US dollar. For example, in the most recent third quarter 2015, currency detracted $466 million from sales versus the third quarter of 2014. (quarterly earnings release, page 5) This is significant considering net income for Q3 2015 was only $368 million.
What is Caterpillar Worth? (Bear Case Valuation):
Our bear case valuation uses a discounted cash flow (DCF) model and forward price-to-earnings (PE) estimates. Our DCF model assumes cash from operations shrinks by 25% in 2015 (versus 2014), and then shrinks by another 5% in 2016, and then finally remains flat thereafter. The 25% decline in 2015 is based on current market conditions and declines through the first nine months of the year. We assume capital expenditures decline by 5% this year and next year, and then remain flat thereafter. We also assume a weighted average cost of capital (WACC) of 5.98% and we assume a zero percent growth rate after 2016. In this scenario, Caterpillar is worth around $77 per share (more than its current stock price):

Using PE multiples as a second check, Caterpillar’s stock currently trades at about 15.54 times management’s 2015 earnings guidance (excluding restructuring costs). This is consistent with year-end 2014 when the ratio was 15.58. For reference, the following chart provides recent history of CAT’s price-to-earnings ratio, and 15.54 is not dissimilar from the recent past.

We exclude restructuring costs (because they are not permanent) but we also exclude the eventual benefits of restructuring (which management expects will be around $1.5 billion per year when restructuring is complete in 2018, Q3 earnings release, p.1).
For 2016, management hasn’t yet provided earnings guidance, but they expect sales to decline another 5%. Assuming the same 5.6% profit margin that management provides for 2015 implies earnings of $4.47 per share (excluding restructuring costs) in 2016. And applying the same 15.54 multiple gives us a price per share value of $69 (which is not dissimilar to the current stock price). However, this methodology ignores the full benefits the company will achieve when restructuring is complete. If we apply the full $1.5 billion in expected future savings, then EPS rises to $4.61 per share, and the stock is worth $72 per share (slightly above its current market price). However, this valuation still ignores the likelihood that Caterpillar will eventually return to growth at some point in the future. Averaging our DCF and PE valuations gives CAT an overall a bear case valuation of around $74 per share, which is slightly above its current market price. And remember, this bear valuation assume CAT declines significantly through 2016, and then never grows again thereafter.
What is Caterpillar Worth? (Bull Case Valuation):
Our bull case scenario DCF model makes the same assumptions as the bear case, except we assume a 2% growth rate after 2016. Two percent is not unreasonable considering the company may stabilize after the large business declines in 2013 – 2016, and begin to grow at a rate consistent with the overall economy. Said differently, there is likely a floor to CAT’s sales declines which we expect the company to approach in 2016. Using these assumptions gives CAT a value of around $116 per share. And realistically, we may see growth higher than 2% for a variety of economic reasons that would result in a value for CAT that is even higher than $116 per share.

Our bull case price-to-earnings assumes the company eventually completes its restructuring and market conditions result in profit margins returning to historically higher levels of around 7%. A 7% profit margin applied to $45.6 billion in sales equals $5.48 in earnings per share. Applying a 15.5 multiple gives CAT a value of around $85 per share. Realistically, sales could be dramatically higher than $45.6 billion if the international resources business picks back up or if US Energy and Transportation increases. As recently as 2012, CAT had revenues of $66 billion, and applying a 7% profit margin and a 15.5 multiple gives the stock a value of over $122 per share. Averaging our DCF and PE valuations gives CAT a bull case value in excess of $100 per share with the potential to climb even more significantly higher.
Is Caterpillar’s Dividend Safe?
Even in our bear case scenario, Caterpillar’s dividend is very safe. CAT generates an enormous amount of free cash flow, and it has over $6 billion of cash and short term investments on its balance sheet. For perspective, CAT paid $1.3 billion in dividends through the first nine months of this year, and has generated $2.7 billion of free cash flow. This means CAT generates plenty of cash to cover the dividend, and they have ample cushion to keep paying (and increasing) the dividend in the future. Worth noting, CAT has increased its dividend 83% since 2009 (Q3 Earnings Release, p.1), and we believe the company has the wherewithal to continue this trend.
Are Caterpillar’s Share Repurchases Prudent?
Given its extra cash, Caterpillar has accelerated the repurchase of its own shares in 2013-2015. For example, the company’s net issuance of shares was positive in 2011 and 2012 ($123 million and $52 million, respectively), but in 2013 they retired (bought back) nearly $1.9 billion, in 2014 they bought back nearly $4 billion, and through the first nine months of 2015 they’ve bought back almost $2 billion. As we’ve written before, public companies have accelerated share repurchases in recent years, and the value of the repurchases is hotly debated by investors. In the case of Caterpillar, we believe the shares are currently undervalued (based on our valuation above), and the share repurchases are prudent and value adding.
Is Caterpillar’s Debt Appropriate?
Caterpillar’s debt load is reasonable, and it is unlikely to hamper the company in the future. For example, the company’s debt-to-assets ratio is a manageable 47.5%. This allows Caterpillar to lever returns for shareholders, and realize tax advantages based on its estimated annual tax rate of 27%, without unnecessarily increasing its risk. For reference, CAT’s debt ratio is lower than its competitor, Deere (Deere has a high 63.6% debt ratio, which may create higher capital costs and increase risk for that company). Additionally, Caterpillar has the ability to retire debt if needed based on its strong cash position.
Is now a good time to buy value stocks with high dividends?
Some investors make the case that it is always a good time to buy value stocks with high dividends. However, given current market conditions, we believe now is a particularly good time to buy value stocks with high dividends (such as Caterpillar). There is a long history of mean reversion in the stock market (recent examples include REITs under-performing by a lot in 2013 and then out-performing by a lot in 2014, and aggressive growth stock Amazon under-performing by a lot in 2014 and now outperforming by a lot in 2015). And recent performance suggests high dividend value stocks are increasingly due for better relative performance. The following chart shows the recent returns of various equity styles and allocations.

Large cap value stocks (such as Caterpillar) as represented by the Russell 1000 Value index have underperformed in recent periods. This is largely due to the accommodative monetary policies of the US Federal Reserve which have favored growth stocks. However, the Fed is widely expected to turn more hawkish in the near future, and this may favor value stocks on a relative basis. Of course predicting the exact timing and speed of the Fed’s policy shift is impossible, but the odds are increasingly favoring value stocks. Additionally, the above chart also suggests dividend stocks are due for better relative performance. For example, the highest dividend yield sectors in the above chart have been the worst performers. And even if the Fed does begin slowly raising interest rates (which is bad for bond prices in general) it will still take years before US treasury yields can compete with attractive dividend yields, especially considering the capital appreciation opportunities of high dividend yield stocks like Caterpillar.
Conclusion:
We like Caterpillar. Its dividend is big, safe and growing. Management is appropriately allocating the company’s ample free cash flow and maintaining an appropriate level of debt. Additionally, Caterpillar’s stock offers considerable opportunity for capital appreciation. Even if Caterpillar’s business shrinks significantly over the next two years and then never grows again, it is still worth more than its current stock price. However, we believe the market is too bearish and too shortsighted in its view of Caterpillar. Rather than never growing again, we believe the company will eventually revert to growth and the stock will be worth dramatically more than its current market price.
International Business Machines (IBM) - Thesis
International Business Machine (IBM) – Thesis
Rating: BUY
Current Price: $131.57 per share
Price Target: $205 per share
Thesis:
To say the least, IBM has been beat up over the last several years. Revenue has declined in 14 consecutive quarters and the stock price has lost a third of its value. Media pundits decry things like “IBM missed the cloud opportunity,” and “it’s a dinosaur kept alive with financial engineering.” But the reality is that IBM is a cash generation machine. It is currently significantly undervalued by the market, and it has a clear path to increasing its intrinsic value even further.

Why has IBM’s stock price declined? For starters, IBM’s stock price has declined because revenue, profits and guidance are declining. And IBM looks even worse when compared to some of its hyped-up peers that are receiving all sorts of cloud glorification (e.g. Amazon Web Services, more on this later). However, IBM’s declining revenues and profits are not entirely due to bad decisions by the company. In addition to bad decisions (such as their cloud strategy, more on this below) the declines are also due to the same macroeconomic headwinds that other companies are facing, as well as spending by IBM to reposition itself for more profits in the future. It is worth reviewing some of these factors to help shed light on the partially-false narrative that IBM’s revenues and profits are declining simply because it is a horrible company (IBM is not a horrible company).
IBM’s legacy businesses are shrinking: IBM’s largest business segment, Global Services (which is a combination of Global Technology Services and Global Business Services) has a shrinking backlog of work. Approximately 60 percent of the segment’s external revenue is annuity based (annual report, p.29) coming primarily from outsourcing and maintenance arrangements. This is a very nice revenue stream for IBM, but it creates a challenge for the company because the backlog is shrinking. For example, IBM’s backlog was $118 billion at the end of the third quarter (third quarter results) , down from $128.4 billion at the end of 2014 and $142.8 billion at the end of 2013 (annual report, p.35). To prevent further valuation declines, IBM will need to find a way to replace this shrinking backlog (we’ll talk more about the company’s “strategic imperatives” later).
IBM continues to divest of some businesses altogether: IBM gave up approximately $7 billion of revenue in 2014 as it divested of businesses that no longer fit its strategic profile (annual report, p.3). For example, IBM announced the divestment of industry standard servers, customer care business process outsourcing services and its microelectronics business. These were unprofitable businesses, but they are still a significant part of the reason IBM’s top line revenues continue to decline.
IBM’s nuanced cloud strategy is weak: IBM is supposed to be a nice safe company, and many investors buy the stock because of this and its attractive dividend. However, it is this nice safe approach to running the business that caused IBM to essentially miss the boat with regards to the cloud. Rather than aggressively pursuing industry-wide cloud, IBM chose a nuanced hybrid-cloud approach whereby they fuse new client solutions with their existing systems. IBM believes they are uniquely qualified to bring value to clients via this hybrid approach, and it also fits nicely with the company’s long-term story of evolving from a hardware company, to a software company, to a services company (annual report, p.28). However, if IBM senior management was more aggressive they would have recognized they were also uniquely positioned a few years ago to aggressively pursue the cloud because of the company’s huge free cash flows, strong brand name, and long history of hardware, software and services. Instead, IBM chose the “safe” approach, and more aggressive firms like Amazon (Amazon Web Services) and Microsoft (Azure) stepped in and are now emerging as the dominant players in the space. Even from a cloud services approach, IBM is getting out hustled by Accenture because of that firm’s agility and willingness to adapt to newer opportunities. For example, Accenture recently purchased Cloud Sherpas and has also formed a strategic alliance with Amazon Web Services (Amazon Q3 release, p.3).
In IBM’s defense, its shareholders would probably not have tolerated a halt in share buybacks and a halt in divided growth in order to use free cash flows to more aggressively pursue the cloud. By comparison, Jeff Bezos over at Amazon doesn’t pay a dividend, halted share buybacks, and allowed the company to generate negative net income in order to aggressively pursue growth opportunities such as the cloud via Amazon Web Services. This behavior simply would not fly among IBM’s shareholders who prefer a nice “safe” company with an attractive dividend yield.
IBM’s growth markets have declined: Not unlike other companies, IBM’s revenues have declined in emerging markets. For example, revenue from the BRIC countries (Brazil, Russia, India and China) decreased 10.7% in 2014 (they decreased only 5% adjusted for divestitures and currency, annual report, p.24). These declines have more to do with global economic conditions than anything IBM did in particular, but they are still detractors, and they help explain why IBM’s overall revenue continues to decline.
Foreign currency continues to negatively impact IBM: Declining revenues are not appealing, but in the case of IBM it is not entirely because of bad decisions by management. For example, IBM’s net income fell 13.9% during the most recent third quarter versus the same quarter a year ago. However, 12.9% of the decline was due to foreign currency impacts. It’s important to understand the impact of FX because without doing so it’s easy to mistakenly assume all of IBM’s declines are due to poor management decisions. Currency exchange rates are out of management’s control (and hedging is expensive and imprecise). Absent FX, IBM’s declines are not as bad as they seem.
IBM is spending now for future growth and profits. Despite IBM’s sub-par cloud strategy, they are still spending heavily to implement it, and it may contribute to increased profitability in the future. The risk is that IBM’s cloud strategy may cannibalize its existing business more than it creates new business. For some color, in 2014 IBM spent approximately 6 percent of its revenue on research and development (R&D) and invested approximately $4 billion on capital investments, largely cloud related. For example, IBM launched Bluemix, the company’s cloud platform-as-a service for the enterprise. It also invested to globally expand its SoftLayer cloud datacenters. Additionally, IBM introduced cloud application innovations around Watson Analytics and Verse (annual report, pp 4-5). IBM believes spending on R&D will help the company succeed in the future.
What is IBM worth?
A basic discounted cash flow model suggests the market is expecting IBM to shrink about 3.3% per year into the future. For example, over the 12-month period ended September 30, 2015 the company generated $17.8 billion in cash from operations, and spent $3.7 billion on capex (IBM Q3-15 and Q4-14 reports), yielding a simplified free cash flow of $14.0 billion (for reference, over the last several years IBM has consistently spent between 20% - 25% of its cash flow from operations on capex). Assuming the firm’s weighted average cost of capital is 7%, we can back into IBM’s current stock price by assigning the company a negative 3.3% annual growth rate. And while IBM’s absolute free cash flows have actually shrunk about 3.3% per year over the last several years, it seems unlikely that they will continue to shrink at this rate indefinitely into the future considering the unique circumstances over the last several years such as strong foreign currency headwinds, divesting of unprofitable businesses, weak emerging market conditions, and spending on initiatives that are expected to yield future growth. Even if IBM were to simply sustain its current business (0% growth) our discounted cash flow model suggest the stock is worth around $205 per share, roughly 45% higher than its current price. And if the company were to grow at all then it would be worth even more.
Another approach to valuing IBM is to compare it to Accenture, which is essentially its closest competitor in terms of the types of business and technology services revenues the two companies generate. The following table compares Accenture to IBM’s Global Services segment (the company’s largest segment by revenue and pre-tax income at around 60% and 48%, respectively).

Source: Google Finance and IBM Q3-15 and Q4-14 reports
And while IBM’s Global Services revenues are more than 50% higher than Accenture’s, the margins are very similar (although IBM’s are slightly better). And considering Accenture trades at roughly 16.1 times its pre-tax income (which seems reasonable), IBM’s Global Services segment should command a stock price of around $146 per share. And $146 per share is slightly higher than IBM’s actual stock price, and it completely excludes the value of IBM’s other business segments: Software, Systems and Technology, and Global Finance. Granted this is not exactly an apples-to-apples comparison (for example Accenture has been experiencing higher growth than IBM), but it still suggests IBM may not be receiving a high enough valuation from market.
IBM and Financial Engineering
Other companies (e.g. Amazon, Microsoft, Accenture) are suffering the same headwinds as IBM (e.g. foreign currency challenges and weak emerging markets) but they’ve more than offset them with growth. By comparison, IBM has not grown and has attempted to satisfy shareholders with dividends and share buybacks. A common complaint against IBM is that these uses of cash are just financial engineering techniques used to boost earnings per share (and to some extent its stock price). We tend to believe these things are more an indication of good stewardship by management, but they are certainly no substitute for good old fashioned organic growth.
But again, in IBM’s defense, investors are attracted to the company’s low-beta stability. Part of the reason IBM is able to consistently return so much cash to shareholders (dividends and share buybacks) is because of its steady backlog of business. And as IBM continues to pale in comparison to its glamorized cloud competitors, its stock price has fallen, and its dividend yield has increased to historically high levels. This should attract more “safe-dividend” type investors to IBM because the dividend is not in jeopardy of being cut based on IBM’s large free cash flow generation.
How can IBM reverse its decline?
If IBM only maintains its current level of business (i.e. it neither shrinks nor grows) then it is still worth significantly more than its current stock price suggests (as noted in our valuation analysis above). We believe the declines in revenue and profits will likely cease for a variety of reasons. For example, the rate of IBM’s significant divestment activities will slow as the company finishes purging its unprofitable and non-strategic businesses. As this happens, revenue declines will cease, and the profitability of the remaining revenue will be higher. Next, the significant declines IBM has experienced due to foreign currency headwinds will likely stabilize, and perhaps even work in IBM’s favor in the future. Further, the declines in emerging markets will likely slow and perhaps even reverse as those economies stabilize. In fact, IBM will likely experience future growth as the overall economy grows. Also, IBM has a variety of “strategic imperatives” that will replace declines in legacy businesses and perhaps even add significantly to future growth.
IBM’s strategic imperatives include data, cloud and engagement (annual report, p.26). IBM believes these imperatives are transforming the IT industry, and that they are uniquely positioned help clients and to profit. Specifically, IBM believes data is the world’s new “natural resource,” and their unique capabilities (such as Watson) will enable them to help clients by refining it. Regarding the cloud, IBM believes they are poised to help enterprises reinvent their entire business models with their cloud computing strategies (again, note IBM’s strategy is about helping large enterprises with hybrid-cloud rather than pursuing newer opportunities with newer companies). And with regards to engagement, including mobile and social technologies, IBM believes they will be a part of fundamentally changing how people interact and get work done (said differently, IBM has vast relationships with existing clients that will ask for help in these areas). Certainly these strategic imperatives provide growth opportunities for IBM, but the extent to which the company succeeds in implementing them will determine if IBM is able to grow enough to offset their declining legacy businesses and perhaps even grow overall.
Conclusion:
IBM is enormously profitable. Its revenues are enormous, its margins are high, its cost of capital is low, its cash flows are steady, its future prospects are looking up, its dividend yield is attractive, and the stock is currently on sale. And while IBM’s cloud business pales in comparison to some of the high-flying glamorized cloud solutions offered by companies like Amazon Web Services and Accenture’s “Cloud Sherpa,” that’s totally fine. IBM’s shareholders don’t want these high-risk high-volatility opportunities. They want IBM.
Phillips 66 (PSX) - Thesis
Phillips 66 (PSX) – Thesis
Rating: BUY
Current Price: $75.20
Price Target $96.00
Thesis:
Phillips 66 (PSX) is the most diverse of the major refining companies, but you wouldn’t know it based on the way the stock trades. Specifically, the market has assigned PSX a valuation similar to other refiners, and the stock trades in lock step. However, the company’s chemicals and midstream businesses warrant a different valuation multiple, and the stock price shouldn’t be quite as highly correlated with other refiners. We believe PSX offers a decreasingly volatile but growing earnings stream and deserves a higher stock price based on its attractive free cash flows that are used to profitably grow the business and reward shareholders with stock buybacks and increasing dividends.
Phillips 66 Overview and Outlook:
The following table from the company’s latest Investor Update shows the earnings (before interest, taxes, depreciation and amortization) of Phillips 66 over the last five years as well as the company’s expectations for 2018.
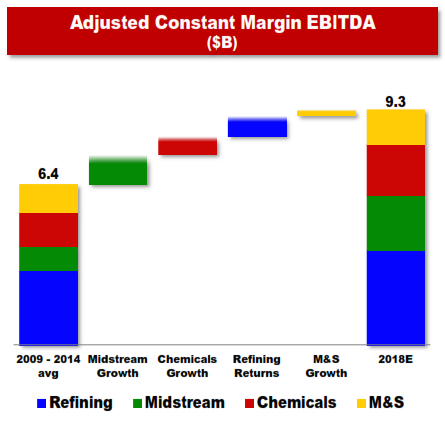
Fast growing midstream and chemicals businesses will generate a significant portion of EBITDA growth, but refining and marketing & sales will also contribute. Refining and marketing & sales are the main business activities of most refining companies, but Phillip’s 66 is unique in the large (and growing) portion of earnings from other businesses (i.e. midstream and chemicals).
Valuation:
This next table shows the typical EV/EBITDA valuation multiple assigned to the various business activities in which PSX is involved (EV is enterprise value, and it’s basically a summation of a company’s total debt and equity value with some minor adjustments). The PSX valuation is higher than its refining peers, but the market is still not giving the company enough credit for the size and growth potential of its chemicals and midstream businesses. Midstream businesses receive a significantly higher multiple due largely to the very stable earnings they generate from long term fee agreements.

If PSX were to receive full credit for its various business segments then its stock would trade significantly higher (around $93 per share) based on its current business mix as high as $100 per share based on its expected 2018 business mix. However, even without this business mix multiple expansion, the stock has significant upside from the large expected EBITDA growth between now and 2018. And unlike its refiner peers, this growth will be generated largely by midstream and chemicals (as well as some growth contributions from refining and marketing & sales). For added perspective, if PSX achieves its expectation of around $2.3 billion of midstream EBITDA in 2018 then the midstream business is worth around $34 billion as a stand-alone company (we used a 14.5x multiple), not far below what the entire company is worth now.
PSX will spend heavily to generate the midstream and chemicals growth, but the company generates more than enough cash to fund the growth and to also reward shareholders with share buybacks and increasing dividends. The following charts show the mix of capital spending as well as the breakdown of cash returned to shareholders.


Conclusion:
PSX is offers an attractive dividend yield and significant capital appreciation opportunity. And if PSX meets its growth expectations and generates $9.3 billion of EBITDA in 2018 then the company is worth significantly more than its current stock price suggests. Further, the stock has even more upside if the market starts giving it credit for its midstream and chemicals businesses instead of just lumping it in with other large (less diversified) refiners.
Small Cap Value (IWN) - Thesis
iShares Russell 2000 Value ETF (IWN)
Expected Return: 9.0% per year
Expected Volatility: 22.0% per year
Rating: BUY
Thesis:
As long-term investors, we believe the equity markets will increase over time, and the small cap value portion of the equity markets will increase more than other styles (e.g. large cap growth), albeit with more volatility. The iShares Russell 2000 Value ETF (IWN) offers reliable exposure to the returns of the small cap value portion of the U.S. equity market while avoiding the many pitfalls that are common among other ETFs and among other equity investments in general.
Holdings:
IWN generally invests at least 90% of its assets in securities of the Russell 2000 Small Cap Value Index. The fund may invest the remainder of its assets in certain derivatives such as futures, options, swap contracts and cash equivalents. The index is one of the most commonly followed equity indices in the U.S., and is largely considered the standard benchmark for small cap value stocks. The performance of IWN has historically matched the performance of the Russell 2000 Small Cap Value Index very closely, and it should continue to track closely in the future because of its construction methodology. Investors cannot purchase the actual index (the Russell 2000 Small Cap Value Index), and IWN is the next best thing.
Volume and Liquidity:
As the standard small cap value ETF in the US, IWN has significant volume and liquidity (total IWN assets exceed $5.5 billion). Because of the volume and liquidity, the bid-ask spread is small (the bid-ask spread is the difference in price at any given time for someone buying the security and someone selling it. There is a difference because the middle man takes a very small cut). A small bid-ask spread is good because it saves you money when you trade. Second, IWN trades very close to its net asset value (NAV) because of the large volume and liquidity. NAV is the actual value if you add up the value of all the securities held within IWN. For many less liquid ETFs, the NAV may vary from its actual market price (the price the ETF trades at in the market). This makes IWN much less risky for investors compared to other ETFs that may vary widely in price versus NAV. Additionally, small investors don’t have to worry about some big investor coming in, buying or selling an enormous amount of IWN, and subsequently adversely moving the market price away from its NAV because the volume of IWN is already so great that this risk is essentially non-existent. Additionally, the fund manager, iShares has the ability to take open-market actions to virtually eliminate the potential price impacts of large trades.
Low Fees:
The net expense ratio on IWN is currently 25 basis points (0.25%). This is extremely low for small cap value market exposure; it is good for investors because it allows them to achieve better returns on their investment. For comparison, small cap mutual funds (a common competitor to ETFs) may charge over 200 basis points (2.0%) per year, and they tend to deliver worse performance over the long-term. Additionally, there is no expensive sales charge or separate investment advisor fee because IWN can be purchased directly through a discount broker (e.g. Scottrade, E*TRADE, TD Ameritrade, Interactive Brokers, etc.). The discount broker may charge you a one-time trading fee of $8 or less, but this is much better than the 2-5% sales charge/management fee you’d get charged by a full service financial advisor. Additionally, there is no hidden 25 basis point (0.025%) annual 12b-1 fee paid to someone for “servicing your account.” The bottom line here is that IWN is a very low cost way to get great exposure to the equity market and to build considerable wealth over the long-term.
Dividend Reinvestment:
One last point of consideration, IWN pays a quarterly dividend (around 2.16% per year), and this dividend is NOT automatically reinvested back into IWN (this is standard protocol for ETFs and stocks). This mean you’ll build up a cash balance in your account if you don’t withdraw it or manually reinvest it. As a long-term investor, cash is generally a drag on investment performance. Unless you plan to withdraw and use the cash, we highly recommend you develop a process to reinvest it. Most discount brokers (Scottrade, Interactive Brokers, etc.) offer automatic dividend reinvestment programs. We highly recommend you sign up for these programs to avoid the situation where cash builds up in your account and becomes a drag on your long-term investment performance. Reinvesting dividends is important.
Conclusion:
IWN is a very low cost, relatively low risk, security that allows investors to build significant wealth over the long-term. We consider IWN to be a basic building block for long-term wealth, and we rate IWN as a “Buy.” For more information, you can view the IWN fact sheet here.
International Stock ETF (IXUS) - Thesis
iShares Core MSCI Total Int'l Stock ETF (IXUS)
Expected Return: 9% per year
Expected Volatility: 25.0% per year
Rating: BUY
Thesis:
As long-term investors, we believe the equity markets will increase over time, and the international (non U.S.) developed and developing (emerging) markets (countries with developed and developing economies) portion of the equity markets will increase at a slightly better rate than the U.S. market, albeit with higher volatility. Non-US exposure also provides very important diversification benefits that are not available by investing in U.S. markets alone. The iShares Core MSCI Total International Stock ETF (ticker: IXUS) offers reliable exposure to the returns of international markets while avoiding the many pitfalls that are common among other ETFs and among other equity investments in general.
Holdings:
IXUS invests in over 3,300 non-U.S. stocks from over 40 developed- and developing-market countries. At least 90% of its assets are invested in securities of the underlying index (MSCI ACWI ex U.S. IMI). The “IMI” portion of the index is important (it stands for Investable Market Index) because in addition to large cap and mid cap stocks, it also includes the small cap portion of the market (the version of the index without the “IMI” is only large cap and mid cap). The fund may invest the remainder of its assets in certain depository receipts and derivatives such as futures, options, swap contracts and cash equivalents. The index is one of the most commonly followed equity indices in the World, and is largely considered the standard benchmark for non-U.S. developed and developing market stocks. The performance of IXUS has historically matched the performance of the MSCI ACWI ex U.S. IMI very closely, and it should continue to track closely in the future because of its construction methodology. Investors cannot purchase the actual index, and IXUS is the next best thing.
Volume and Liquidity:
As a standard ETF, IXUS has significant volume and liquidity (total IXUS assets exceed $1.7 billion). Because of the volume and liquidity, the bid-ask spread is small (the bid-ask spread is the difference in price at any given time for someone buying the security and someone selling it. There is a difference because the middle man takes a very small cut). A small bid-ask spread is good because it saves you money when you trade. Second, IXUS trades very close to its net asset value (NAV) because of the large volume and liquidity. NAV is the actual value if you add up the value of all the securities held within IXUS. For many less liquid ETFs, the NAV may vary from its actual market price (the price the ETF trades at in the market). This makes IXUS much less risky for investors compared to other ETFs that may vary widely in price versus NAV. Additionally, small investors don’t have to worry about some big investor coming in, buying or selling an enormous amount of IXUS, and subsequently adversely moving the market price away from its NAV because the volume of IXUS is already so great that this risk is essentially non-existent. Additionally, in the extremely rare case where a big trade could cause a big discount or premium, the fund manager (iShares by BlackRock) has the sophistication to engage in open market trading activity to avert the large mispricing relative to the NAV (some other ETF managers do not have this same level of sophistication).
Low Fees:
The net expense ratio on IXUS is currently 14 basis points (0.14%). This is extremely low for international market exposure; it is good for investors because it allows them to achieve better returns on their investment. For comparison, international mutual funds (a common competitor to ETFs) may charge over 300 basis points (3.0%) per year, and they tend to deliver worse performance over the long-term. Additionally, there is no expensive sales charge or separate investment advisor fee because IXUS can be purchased directly through a discount broker (e.g. Scottrade, E*TRADE, TD Ameritrade, Interactive Brokers, etc.). The discount broker may charge you a one-time trading fee of $8 or less, but this is much better than the 3-5% sales charge/management fee you’d get charged by a full service financial advisor. Additionally, there is no hidden 25 basis point (0.025%) annual 12b-1 fee paid to someone for “servicing your account.” The bottom line here is that IXUS is a very low cost way to get great exposure to the equity market and to build considerable wealth over the long-term.
Dividend Reinvestment:
One last point of consideration, IXUS pays a quarterly dividend (around 2.57% per year), and this dividend is NOT automatically reinvested back into IXUS (this is standard protocol for ETFs and stocks). This means you’ll build up a cash balance in your account if you don’t withdraw it or manually reinvest it. As a long-term investor, cash is generally a drag on investment performance. Unless you plan to withdraw and use the cash, we highly recommend you develop a process to reinvest it. Most discount brokers (Scottrade, Interactive Brokers, etc.) offer automatic dividend reinvestment programs. We highly recommend you sign up for these programs to avoid the situation where cash builds up in your account and becomes a drag on your long-term investment performance. Reinvesting dividends is important.
Conclusion:
IXUS is a very low cost, relatively low risk, security that allows investors to build significant wealth over the long-term. We consider IXUS to be a basic building block for long-term wealth, and we rate IXUS as a “Buy.” For more information, you can view the fact sheet for this ETF here.
EastGroup Properties (EGP) - Thesis
EastGroup Properties (EGP)
Current Price: $55.63 per share
Price Target: $62.34 per share
Rating: BUY

Thesis:
EastGroup Properties (EGP) is an industrial Real Estate Investment Trust (REIT), and we like it despite its negative 8.4% total return in 2015. It declined in 2015 for a variety of reasons including lackluster overall market performance, slightly lower occupancy rates, lower year-over-year third-quarter earnings, fear that company’s Houston area properties will suffer from a challenged local energy market, and fear that rising interest rates will pressure the business. However, we believe EGP’s poor 2015 performance is temporary, and it provides an excellent buying opportunity for long-term value investors that seek above average dividends.

About EGP:
EastGroup Properties, Inc. (EastGroup) is an industrial equity REIT focused on the development, acquisition and operation of industrial properties in Sunbelt markets throughout the United States. EastGroup holds its properties as long-term investments. The Company owns approximately 307 industrial properties and one office building. These properties are located in the states of Florida, Texas, Arizona, California and North Carolina. The Company has developed approximately 37% of its total portfolio (on a square foot basis), including real estate properties and development properties in lease-up and under construction. The Company's focus is the ownership of business distribution space (80% of the total portfolio) with the remainder in bulk distribution space (16%) and business service space (4%). EastGroup competes on location (not rent), and clusters properties around a variety of transportation features.
EGP’s business is healthy and growing:
EGP’s business is strong for a variety of reasons. For example, occupancy rates remain high. Specifically, properties were 96.6% leased and 95.8% occupied as of September 30, 2015 (this is down very slightly from 96.7% leased and 96.3% occupied on December 31, 2014). Additionally, EGP’s balance sheet remains strong and flexible. Its debt-to-total market capitalization is low especially compared to peers:

As of the end of the last quarter, ESG had both interest and fixed charge coverage ratios of 4.6x and a debt to earnings before interest, taxes, depreciation and amortization (EBITDA) ratio of 6.30x. Further, EastGroup’s customer base is large and diverse. At year-end 2014, EGP had over 1,400 customers with an average size of 23,000 square feet and a weighted average lease term of 5.6 years. (2014 Annual Report)
Addtionally, EastGroup is growing. For example, EGP’s development program consists of 21 projects (2.1 Million Square Feet) at September 30, 2015 with a projected total investment of $157 million. Additionally, Funds from Operations (FFO) attributable to common stockholders were $.94 per share at the end of the third quarter up from $.89 per share for the same quarter of 2014, an increase of 5.6%. Also, same property net operating income increased 1.3% for the quarter ended September 30, 2015, compared to the same quarter in 2014.
EGP’s dividend is attractive and safe:
EastGroup has increased or maintained its dividend for 23 consecutive years. This is important for dividend investors, especially considering many of EGP peers had to cut their dividends during the recession of 2007-2009. EGP’s dividend to FFO ratio (over the last 12 month) is also relatively low compared to peers (this is a sign of safety).

Further, the dividend has increased in each of the last four years. For reference, EGP historical dividend to FFO ratio is included in the following chart:

What is EGP Worth?
On a price-to-earnings basis, EGP looks expensive (36.6 times), but a more relevant REIT valuation metric is price-to-FFO. FFO stands for Funds from Operations, and it is calculated as Net Income adjusted for Depreciation, Amortization, and Property Sales. Depreciation has a big impact on REITs considering their business is real estate. On a price to FFO ratio, EGP is trading around 15.4 times, a much more reasonable metric than the PE ratio. This price to FFO ratio is below EGP’s recent historical multiple indicating the stock is priced attractively based on this metric.

If EGP FFO multiple were to return to the 17.1 average from 2011-2014, then the stock would trade around $62.34, 11.3% higher than its current stock price. And 11.3% capital appreciation combined with a 4.3% dividend yield is an attractive proposition for a relatively lower risk REIT. And while full-year 2015 results won’t be released until February 1st, management expects FFO between $3.66 and $3.68 per share. Applying the same 17.1 multiple suggests a stock price of $62.75.
Further, industrial REITS will grow as the economy grows. No one has a crystal ball, but we believe the economy will continue to grow over the long-term. Plus, EGP’s properties are highly valuable as they’re located in primary industrial locations relative to transportation features that are important to industrial companies. We believe the combination of lower debt, lower dividend payout ratios (meaning more safety and growth potential), and primary industrial locations makes EGP a lower risk investment with more upside compared to many of its peers.

Real Estate Sector:
Worth noting, we may see some additional demand and volatility for REITs later in 2016 as Real Estate is set to get its own official sector classification after market close on August 31, 2016.
Conclusion:
We believe EastGroup Properties is an attractively priced industrial REIT with an above average (and growing) dividend. The stock adds important diversification to our long-term investment portfolio. The company obviously faces many of the industry specific risks that other REITs face (such as general economic and real estate market risks), but this is why we own EGP as only one part of our diversified long-term portfolio. Most importantly, relative to other REIT options, we believe EastGroup Properties provides a very attractive risk-reward tradeoff. We rate EGP a BUY, and we own shares of the stock.
First American Financial (FAF) – Thesis
First American Financial (FAF)
Rating: BUY
Current Price: $35 per share.
Target Price: $53 per share.

Thesis:
First American Financial (FAF) issues title insurance for commercial and residential properties and issues specialty insurance for residential homeowners and renters. FAF is a small mid-sized company ($3.9 billion market cap) and the business is healthy and growing. The stock is undervalued on a variety of traditional metrics, and its above average dividend has the potential for continued increases. We rate First American Financial a “BUY” and have a price target of $53 per share giving the stock more than 50% upside versus its current price.
About FAF:
First American Financial has been a leader in title insurance for over 125 years, and currently has a 27.6% market share in the US (FAF is #2 in US market share behind #1 Fidelity National Financial (FNF)). FAF offers its products and services directly and through its agents and partners throughout the United States and in more than 60 countries. In June 2010 First American Corporation split into two companies, First American Financial (FAF) and CoreLogic (CLGX) which is a provider of property information, analytics and data-enabled services. FAF’s market share is split between agent and direct sales.

FAF’s Competitive Advantage:
First American Financial’s main competitive advantage is that is has aggregated unique sets of data that are compelling to customers. Specifically, FAF claims to have the #1 property information database, they believe they are #1 in title plants, and #1 in land recovery documents. And having the most comprehensive data is critical in the title search business because it enables better underwriting and reduces costly claims (lenders demand “defect free” mortgages). As an example, FAF’s DataTree.com is compelling to customers because if conveniently offers more comprehensive data, highly valuable “FlexSearch” options and valuable analytics. And unlike other companies, FAF is exclusively focused on real estate finance, the company has a highly experienced team and they’ve built widely expansive customer relationships in key markets.
Why is FAF's dividend above average?
First American Financial currently offers a 2.79% dividend yield (this is higher than the S&P 500 dividend yield which is currently just above 2%). FAF is able to pay a strong dividend because it generates lots of steady free cash flow.

FAF has been able to increase its dividend significantly in recent years as shown in the following chart:
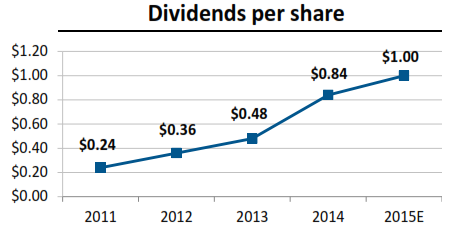
And as a percent of net income, the dividend payout ratio is sustainable, and there is room to continue to increase the dividend in the future:

Source: FAF
What is FAF Worth?
First American Financial is currently undervalued based on a variety of traditional valuation metrics. For starters, the company’s price to earnings ratio is only 13.5 which is low compared to the S&P 500 (which is almost 22), and it’s low compared to the financial sector (for example, the iShares Dow Jones US Financial ETF PE ratio is 14.75).
FAF’s PEG ratio (price/earnings/growth) is only 1.24 which very compelling because it suggests the stock is cheap for the amount of growth that is expected. The average PEG ratio for FAF’s industry and sector are 2.92 and 2.54, respectively, suggesting FAF is offering an attractive price. According to the nine professional analysts covering the stock (as listed on Yahoo Finance http://finance.yahoo.com/q/ae?s=FAF+Analyst+Estimates ) the company is expected to grow its earnings at an average annual rate of 11.3% over the next five years (and this rate is higher than the S&P 500 for example). The PEG ratio suggests FAF is attractively priced given its expected growth.
A basic discounted cash flow model suggests FAF is undervalued and that its stock should be trading at a significantly higher price. For example, assuming FAF generates $300 million of free cash flow in 2015 (they’ve already generated $260 million through the first nine months), a 7.2% weighted average cost of capital (WACC), and 0% growth rate, then FAF should be trading at around $38 per share (it currently trades at around only $35 per share). However, the company is expected to growth at a faster rate as we mentioned above (and as we’ll discuss more below). If we assume the company’s long-term growth rate is 2% per year, then the stock should be trading around $53 per share. This suggests the stock has over 50% upside. This is significant.
Why is now a good time to buy FAF?
For starters, management believes mortgage originations we’re at a low point in 2015, and they expect growth in 2015 and beyond (investor presentation, p.4). For reference, the following chart shows recent origination data.

An increase in originations suggest an increase in FAF business which should add to the company’s bottom line. Additionally, revenues (and earnings) should increase over time simply through ordinary long-term economic expansion.
Another reason to buy now is because the price has declined over the last several month providing some margin of safety. The price has declined because the company missed earnings expectations by 6 cents per share on October 22nd due to weakness in FAF’s specialty insurance business because of claim losses due to California wildfires. However, the company improved during the quarter in other categories across the board including overall revenue increases, improved margins in title insurance and average revenue per order, for example. Additionally, the company’s overall valuation (as described previously) is attractive.
What are the Risks?
First American Financial faces a variety of risks that could negatively affect its business. For example, higher payouts in its specialty insurance business (as described above with California wildfires) can negatively impact earnings. There is always uncertainly with future claims payouts. All the underwriting sophistication in the world still cannot predict the future. Fortunately for FAF, specialty insurance is only a small percent (usually less than 10%) of the company’s overall business.
Regulations are another significant risk. In its annual report, FAF explains that changes in government regulation could prohibit or limit the Company’s operations, make it more burdensome to conduct such operations or result in decreased demand for the Company’s products and services. For example, new TILA-RESPA disclosure laws released in October will impact the way FAF does business.
Another risk is simply the overall conditions in the real estate market. These conditions generally impact the demand for a substantial portion of FAF’s products and services and its claims experience. As discussed previously, mortgage origination activity can have a very significant impact on the company. As mentioned previously, FAF management believes we’re at or near a low-point in originations, and there is more origination activity and transactions expected going forward.
Conclusion:
First American Financial is underpriced and offers significant upside price appreciation. The stock also offers an attractive dividend payout ratio with the potential to grow. We believe activity in the mortgage origination market is closer to the lower end of the cycle, and this gives FAF more upside than down in this regard. We also believe the company offers competitive advantages (mainly its expansive easy-to-use data). Additionally, we believe the recent decline in stock price (due to a short-term 6 cent miss at its last earnings announcement) provides some margin of safety. We rate First American Financial (FAF) a BUY.
Westar Energy (WR) - Thesis
Rating: BUY
Current Price: $39.92
Price Target: $46.48
Thesis:
We own Westar Energy because it offers shareholders a growing dividend and opportunities for capital appreciation. We also appreciate the company’s diverse energy generation mix, including its growing renewables capacity. Lastly, as a utilities company, Westar adds important diversification to our Blue Harbinger 15 portfolio.
Westar Energy is the largest electric energy provider in Kansas. The company provides generation, transmission and distribution to approximately 687,000 customers. Westar maintains a flexible and diverse energy supply portfolio. In doing so, they continue to make environmental upgrades to their coal-fired power plants, develop renewable generation, build and upgrade their electric infrastructure and develop systems and programs with regard to how their customers use energy. The following chart shows Westar’s mix of energy generation capacity:

The diverse sources of energy, particularly renewables, are important and valuable because Westar faces significant environmental regulation challenges. Some companies throughout the US generate almost all of their energy from coal, and this exposes them to heightened regulatory risks as coal is the dirtiest form of energy. Westar acknowledges this risk in their annual report as follows:
“Our costs of compliance with environmental laws and regulations, including those relating to greenhouse gas emissions, are significant, and the future costs of compliance with environmental laws and regulations could adversely impact our operations and consolidated financial results.”
Because Westar has significant renewables capacity, it keeps the company out of the direct cross-hairs of federal regulators who often have little regard for the economic impacts of expensive regulations on the well-being of the surrounding communities. Additionally, Kansas is a strongly republican state which means it tends to be less extreme with regards to the imposition of expensive environmental regulations.
Important for future growth of the company, Westar operates in economically healthy regions of Kansas including the cities of Topeka, Lawrence, Manhattan, Salina, Hutchinson and Wichita. Unemployment is low in these areas, and Westar is a large employer. The strong economy helps ensure Westar also remains strong. The following chart shows the breakdown of Westar’s customer base:

In March 2015, Westar requested approval from the Kansas Corporation Commission to increase the rates it charges by 7.9% or $152 million to recover Environmental Protection Agency (EPS) costs as well as increased service reliability. And in August they reached an agreement for a $78 million rate increase. The approved rate increase demonstrates the region’s support for Westar Energy.
Valuation:
We value Westar at $46.48 per share by discounting its $2.44 expected 2015 earnings per share using a required rate of return of 6% (weighted average cost of capital) and a growth rate of only 0.75% per year which is the long-term rate Westar expects (annual report p.28). If the growth rate ends up being higher than 0.75% then the stock is worth even more. Our $46.48 price target gives the stock more than 16% upside, with potential for further increases depending on the company’s future growth and profitability.
Dividends:
In addition to potential gains via capital appreciation, Westar offers shareholders an increasing dividend. Dividends are common for stable utility companies like Westar, and in this case Westar offers and attractive 3.62% dividend yield. And the amount of Westar’s dividend payments has increased over time (see graph below), and the company expects this trend to continue.

Conclusion:
Westar is a diversified electric utility company that rewards shareholders with a growing dividend and opportunity for capital appreciation. Additionally, this electric utility company investment adds important sector diversification to our Blue Harbinger 15 portfolio. It is important to invest across a variety of market sectors (e.g. utilities, consumer discretionary, technology, etc.) to reduce exposure to sector specific risks and to minimize overall volatility in the value of your investment portfolio.
Johnson & Johnson (JNJ) - Thesis
Rating: BUY
Current Price: $95.06
Price Target: $122.60
Thesis:
Johnson & Johnson is a blue chip among blue chip companies, and now is an excellent time to buy. JNJ has an amazing track record of increasing its adjusted earnings for 31 consecutive years and increasing its dividend for 53 consecutive years. The dividend yield is currently an attractive 3.2%, and the stock price has recently pulled back making now a great time to buy.
Overview:
Operating across its three main segments (Consumer, Pharmaceutical, and Medical Devices), the company is home to many names you’ve heard of (e.g. Band-Aid, Tylenol, Listerine, Visine) and many other great health care products people rely on around the world (you can view the company’s products here). In fact, Johnson & Johnson sells products in virtually every country in the world. The company’s global sales gives investors an added level of diversification beyond just the diversified products and business segments. In 2014, JNJ had $74.3 billion in total sales. Forty-three percent of the sales came from the Pharmaceutical segment, 37% from Medical Devices and the remaining 20% from the Consumer segment.
Valuation:
We value JNJ using a 50/50 combination of discounted free cash flows and Ben Graham’s (EPSx(8.5+2xGr)) formula. In both valuations, we assume the company can grow at 5% per year. The average 5-year earnings growth estimate of the 19 professional analysts included on Yahoo Finance is 4.96%. We believes JNJ provides will benefit from a global demographic trend which the company aptly explains as follows: “the historic aging rate of the world’s population, along with a growing middle class around the world, brings dramatically greater demand for higher quality health care” (Annual Report, p.3). Our discounted cash flows analysis uses a 9% required rate of return (CAPM derived), and values JNJ at $131.54 per share. Graham’s formula assigns the company a $113.65 price per share. We use the average of the two to value JNJ at $122.60, which is well above its current price.
Cash:
JNJ has a history of returning cash to shareholders through dividends and share buybacks. As mentioned previously, the dividend has increased for 53 consecutive years. In aggregate, the company paid $7.8 billion for dividends in 2014. They also repurchased $7.1 billion of its own stock (this is another way to return cash to shareholders).
Buying Opportunity:
JNJ’s stock price is down this year for two main reasons, and the fact that it is down makes now a good time to buy. First, JNJ is down with the rest of the broader market. As bad economic data out of China and jitters about the US Federal Reserve’s upcoming interest rate hike have hit JNJ just like almost every other stock in the market. And second, JNJ earnings are being hurt by foreign currency fluctuations. Specifically, the strong US dollar makes international sales less profitable for the company. However, these two things make JNJ more attractive now than it was before because the broad market pullback is only temporary (the world will go on) and foreign currency volatility is stabilizing. (currency markets have been highly volatile since the “Great Recession” on 2008-2009).
Conclusion:
The main reason most individual investors buy Johnson & Johnson stock is for the dividend. It’s a steady stable company, and the dividend payments keep rolling in quarter after quarter. However, the stock also offers the opportunity for capital appreciation. And while there is no guarantee the stock price will go up tomorrow, this month, or this year, we believe strongly it will go up over the long-term. As the company says “the historic aging rate of the world’s population, along with a growing middle class around the world, brings dramatically greater demand for higher quality health care,” and JNJ is a leader in meeting these needs.
U.S. Value Stock ETF (IWD) - Thesis
iShares Russell 1000 Value ETF (ticker: IWD)
Expected Return: 8.75% per year
Expected Volatility: 18.0% per year
Rating: BUY
Thesis:
As long-term investors, we believe the equity markets will increase over time, and the “value” portion of the equity markets will increase at a slightly better rate than the rest of the market. Value stocks are defined as stocks with lower price-to-book ratios and less aggressive earnings growth expectations. They’re basically stocks that are on sale. Empirical research has shown that value stocks have outperformed the rest of the market over the long-term (10+ year periods). Additionally, value stocks have moderately under-performed the rest of the markets over the last several years which makes them even more attractive (because they’re on sale). We believe the reason value stocks have underperformed in recent years is because the accommodative monetary policies of the U.S. Federal Reserve since the great recession in 2009 have favored “growth” stocks. Specifically, stocks that need to borrow more money to grow have been able to borrow it at attractively low rates because of the low interest rates set by the Fed. As the Fed raises rates over the coming market cycle (they next three to 10 years) this will be a headwind to growth stocks and it will favor value stocks. Regardless of where we’re at in the market cycle, value stocks tend to outperform over the long-term, and the Russell 1000 Value ETF (ticker: IWD) offers reliable exposure to the returns of value stocks while avoiding the many pitfalls that are common among other ETFs and among other equity investments in general.
Holdings:
IWD invests in over 650 large US companies classified as “value” stocks. At least 90% of its assets are invested in securities of the Russell 1000 Value Index. The fund may invest the remainder of its assets in certain derivatives such as futures, options, swap contracts and cash equivalents. The index is one of the most commonly followed equity indices in the World, and is largely considered the standard benchmark for U.S. large company value stocks. The performance of IWD has historically matched the performance of the Russell 1000 Value Index very closely, and it should continue to track closely in the future because of its construction methodology. Investors cannot purchase the actual index, and IWD is the next best thing.
Volume and Liquidity:
As a standard ETF, IWD has significant volume and liquidity (total IWD assets exceed $23.5 billion). Because of the volume and liquidity, the bid-ask spread is small (the bid-ask spread is the difference in price at any given time for someone buying the security and someone selling it. There is a difference because the middle man takes a very small cut). A small bid-ask spread is good because it saves you money when you trade. Second, IWD trades very close to its net asset value (NAV) because of the large volume and liquidity. NAV is the actual value if you add up the value of all the securities held within IWD. For many less liquid ETFs, the NAV may vary from its actual market price (the price the ETF trades at in the market). This makes IWD much less risky for investors compared to other ETFs that may vary widely in price versus NAV. Additionally, small investors don’t have to worry about some big investor coming in, buying or selling an enormous amount of IWD, and subsequently adversely moving the market price away from its NAV because the volume of IWD is already so great that this risk is essentially non-existent.
Low Fees:
The net expense ratio on IWD is currently 20 basis points (0.20%). This is extremely low for value stock exposure; it is good for investors because it allows them to achieve better returns on their investment. For comparison, value mutual funds (a common competitor to ETFs) may charge over 150 basis points (1.5%) per year, and they tend to deliver worse performance over the long-term. Additionally, there is no expensive sales charge or separate investment advisor fee because IWD can be purchased directly through a discount broker (e.g. Scottrade, E*TRADE, TD Ameritrade, Interactive Brokers, etc.). The discount broker may charge you a one-time trading fee of $8 or less, but this is much better than the 2-5% sales charge/management fee you’d get charged by a full service financial advisor. Additionally, there is no hidden 25 basis point (0.025%) annual 12b-1 fee paid to someone for “servicing your account.” The bottom line here is that IWD is a very low cost way to get great exposure to the equity market and to build considerable wealth over the long-term.
Dividend Reinvestment:
One last point of consideration, IWD pays a quarterly dividend (around 2.49% per year), and this dividend is NOT automatically reinvested back into IWD (this is standard protocol for ETFs and stocks). This means you’ll build up a cash balance in your account if you don’t withdraw it or manually reinvest it. As a long-term investor, cash is generally a drag on investment performance. Unless you plan to withdraw and use the cash, we highly recommend you develop a process to reinvest it. Most discount brokers (Scottrade, Interactive Brokers, etc.) offer automatic dividend reinvestment programs. We highly recommend you sign up for these programs to avoid the situation where cash builds up in your account and becomes a drag on your long-term investment performance. Reinvesting dividends is important.
Conclusion:
IWD is a very low cost, relatively low risk, security that allows investors to build significant wealth over the long-term. We consider IWD to be a basic building block for long-term wealth, and we rate IWD as a “Buy.” For more information, you can view the fact sheet for this ETF here.
U.S. Bancorp (USB) - Thesis
U.S. Bancorp (USB)
Rating: BUY
Current Price: $44.81
Price Target: $61.69
Thesis:
U.S. Bancorp (USB) has a strong balance sheet, an appropriate mix of business segments, it consistently generates lots of free cash flow, it is trading below its intrinsic value, and it has room for continued earnings growth if/when interest rates rise.
Valuation:
By discounting cash returned to shareholders (dividends plus share repurchases), USB is worth $61.69 per share, 37.7% more than its current market price. In 2014 and 2013, USB returned 72% and 71% of earnings to shareholders (dividends and share repurchases), respectively. In 2013, the company stated its target was to return 60%-80% of earnings to shareholders annually, and this target has come down since pre-financial crisis (for example, in 2006 USB stated their goal was 80% per year). Discounting this cash returned to shareholders using a discount rate of 5.75% (weighted average cost of capital) and assuming a 2.0% perpetual growth rate (USB grows at about the same rate as the economy), yields a valuation of: ($5.85 billion [2014 earnings] X 70% [% of earnings returned to shareholders]) / (5.75% - 2%) = $109.2 billion. Since there are approximately 1.77 billion shares outstanding, this results in a valuation of $61.69 per share. And potentially more if interest rates rise allowing USB to achieve additional growth from a higher margin on deposits.
U.S. Bancorp’s Business: - Appropriately Diversified:
Headquartered in Minneapolis, Minnesota, the business of U.S. Bancorp (aka US Bank) is appropriately diversified. The company has chosen to operate across four main market segments, and the company’s revenue generation is balanced between margin and fee businesses. USB CEO, Richard Davis, believes USB operates in “precisely the markets where we compete the best, and we are confident this mix of businesses has us well positioned for the future.” (2014 Annual Report). The four main business segment are: Consumer and Small Business Banking; Wholesale Banking and Commercial Real Estate; Wealth Management and Securities Services; and Payment Services. Consumer and Small Business Banking is the largest generating around 39% of net interest income and 28% of non-interest income. In 2014, USB’s interest income (taxable equivalent basis) was $11.0 billion and its noninterest income was $9.2 billion. Consumer and Small Business Banking is largely regional, Wholesale Banking and Commercial Real Estate as well as Wealth Management and Security Services is national, and Payment Services and Global Corporate Trust is international.
Relatively Safe:
U.S. Bancorp’s business is relatively safe, providing the company favorable funding costs, strong liquidity, and the ability to attract new customers. For example, the company consistently receives credit ratings among the highest in the industry. USB already exceeds advanced Basel III risk weighted asset ratios as if they were already fully implemented. The company’s debt-to-equity ratio has come down considerably in recent years (from over 3.0 to under 1.5, driven in large part by regulatory requirements), and while this also reduces the bank’s earnings power, it also significantly reduces the bank’s risk.
Additionally, USB’s business mix (i.e. multiple business segments and the split between interest and non-interest income) provides a consistent income stream that can weather a variety of market conditions. Further, Global Finance Magazine ranked USB as one of the World’s safest banks in 2012, 2013 and 2014. And in February 2015 USB was named Fortune Magazine’s Most Admired Super-Regional Bank for the fifth consecutive year. This relative safety helps USB to consistently deliver results.
Growth:
USB has multiple sources of potential growth including expanding margins, growing business segments, and simply increasing business as the overall economy grows. For example, interest rates in the US are expected to increase within the next year; this will allow USB to earn a higher spread on the rate they pay depositors and earn from borrowers. Also, USB has opportunity to grow non-interest income (currently roughly 46% of income) by increasing revenue especially from credit and debit card services as well as merchant processing services. Further, USB’s non-interest income should grow in general as the economy grows.
Risks:
Major risks for USB include increased government regulations and the possibility that interest rates do not increase in the foreseeable future. Regulatory reserve requirements have dramatically reduced leverage (and risk) in the banking industry, however these regulations have also reduced the earnings power of the banks as well as their ability to return capital to shareholders as they see fit. If regulators were to increase or tighten requirements this could have an adverse impact on USB’s ability to earn profits. Regarding interest rates, USB will not be able to grow earnings as quickly if interest rates do not start increasing in the next year as the US Federal Reserve has indicated they will. Low interest rates have compressed margins for USB (and banks in general), and without raised rates and margin expansion USB’s earnings growth will be challenged.
Conclusion:
U.S. Bancorp (USB) is relatively safe compared to banking sector peers, and has demonstrated the ability to consistently deliver profits in good and bad market conditions. Our discounted cash flow valuation model indicates the stock price is below its intrinsic value. Additionally, a rising interest rate environment increases USB’s earnings power and provides additional upside to the stock price. We value USB at $61.69 per share, and rate the stock a “Buy.”
Procter & Gamble (PG) - Thesis
Procter & Gamble (PG)
Rating: Buy
Current Price: $81.63
Price Target: $99.79
Thesis:
Procter & Gamble’s stock price is depressed because of strong foreign currency headwinds and a variety of sub-optimal market ventures. The currency headwinds will likely subside as global monetary policies continue to normalize as the financial crises moves further into the rear-view mirror. Additionally, the company’s current multi-year restructuring will increase profitability by increasing efficiency and by shedding sub-optimal market ventures. Using a discounted cash flow model, Procter & Gamble is worth $99.79 per share, giving the stock more than 22% upside versus its current market price.
Foreign Currency Headwinds:
Approximately 61% of Procter & Gamble’s sales come from outside the United States. This creates a variety of foreign currency challenges for the company, especially since the US dollar (the company’s reporting currency) has strengthened significantly in the last year. In fact, the company expects to take an approximately $1.4 billion hit to earnings in 2015 because of the strong US dollar. This is significant considering PG’s total earnings are only around $11.6 billion per year. Foreign currencies have weakened versus the US dollar for a variety of reasons. For example, the US economy is recovering from the global financial crisis quicker than other economies, and while the US is beginning to reduce accommodative monetary policies, non-US economies are still introducing more accommodative policies. Regardless, recent currency volatility will eventually decline, and P&G will also tweak its foreign currency hedging programs. The result will be less foreign currency challenges, and P&G’s earnings will pop up. Also, there could be quarters and years in the future where PG’s earnings are helped by foreign currency moves in which case earnings will pop up even more.
Restructuring:
P&G is currently in the process of shedding a variety of less profitable brands. According to CEO A.G. Lafley:
"P&G will become a simpler, more focused Company of 70 to 80 brands, organized into about a dozen businesses and four industry-based sectors. We will compete in businesses that are structurally attractive and best leverage our core capabilities. Within these businesses, we will focus on leading brands or brands with leadership potential, marketed in the right countries where the size of prize and probability of winning is highest, with products that sell. We will discontinue or divest businesses, brands, product lines, and unproductive products that are structurally unattractive or that don’t fully play to our strengths… The 90 to 100 brands we plan to exit have declining sales of -3%, declining profits of -16% and half the average Company margin during the past three years."
In addition to shedding some 90 to 100 brands, P&G is also in the middle of a multi-year productivity and cost-savings plan. Per the company’s annual report:
"In 2012, the Company initiated a productivity and cost savings plan to reduce costs and better leverage scale in the areas of supply chain, research and development, marketing and overheads. The plan was designed to accelerate cost reductions by streamlining management decision making, manufacturing and other work processes to fund the Company's growth strategy. As part of this plan, the Company expects to incur in excess of $4.5 billion in before-tax restructuring costs over a five-year period (from fiscal 2012 through fiscal 2016). Approximately 62% of the costs have been incurred through the end of fiscal 2014. Savings generated from the restructuring costs are difficult to estimate, given the nature of the activities, the corollary benefits achieved (e.g., enrollment reduction achieved via normal attrition), the timing of the execution and the degree of reinvestment. Overall, the costs and other non-manufacturing enrollment reductions are expected to deliver in excess of $2.8 billion in annual gross savings (before-tax). The cumulative before-tax savings realized through 2014 were approximately $1.4 billion."
P&G’s profitability will increase as the multi-year restructuring is completed and as less profitable brands are exited. This helps create the room for significant upside to the current stock price.
Growth Opportunities:
In addition to restructuring, P&G does have some growth opportunities. To some extent, P&G will grow as the total global population grows. Additionally, the secular trend in emerging markets whereby populations move from rural to more urbanized and suburbanized areas benefits P&G because these populations tend to use more P&G products.
Additionally, P&G spent $2.0 billion on research and development in 2012, 2013 and 2014. Examples of recent product introductions include the Fusion ProGlide (introduced four years ago, priced at the higher end of the premium segment, grew global share for 31 consecutive quarters, and reached $1 billion in sales faster than any other P&G brand in history) and Crest 3D White (a premium oral care regimen, has grown market share for 17 consecutive quarters, is a billion-dollar business, and is an important driver of toothpaste market share growth in developing markets).
Valuation:
We value PG at $99.79 using a discounted cash flow valuation. We assume 2014 free cash flow of $10.11 billion grows at 3.5% in the future (conservative estimate roughly equal to global economic growth), $1.0 billion of the estimated $1.4B negative 2015 currency impact returns to a more neutral level of negative $0.4B (remember if the US dollar weakens it could actually help P&G), P&G restructuring amounts to $1.4 billion of additional annual cash flow (conservative estimate, less than P&G’s own estimate) and the required rate of return is 8.5% (long-term capital market assumption):
[($10.11B x 1.035 + $1.0B + $1.4B) / (0.085 – 0.035) + 13.16B of cash ] / 2.71B shares = $99.79 per share.
As a double check, a “Dividend + Share Repurchase” model suggests the company is worth around $100.06 per share. This valuation technique is relevant for PG because the company is very stable and consistently pays increasing dividend and buys back shares. Here is the calculation: [($6000 of share repurchase + $6900 of dividends) / (8.5% required return – 3.5% growth) + $13160 cash] / 2710 shares = $100.06 per share.
Conclusion:
Procter & Gamble has underperformed the S&P 500 by roughly 14% year-to-date, and trades more than 22% below its intrinsic value per our discounted cash flow valuation model. A “dividend + share repurchase” discount model also suggests the stock is significantly undervalued. PG stock is depressed as the company has been hampered by severe foreign currency headwinds (the US dollar is strong) and a variety of (soon-to-be eliminated) sub-optimal market ventures. PG currently trades around $81.63 per share, and we believe it is worth more. Our price target is $99.79 per share.