

If you are an income-hungry investor, PIMCO offers a variety of low-beta, fixed-income Closed-End Funds (“CEFs”) that are worth considering. In this report, we analyze three of them, multi-sector funds (PFL) (PHK) and (PCI), considering sector allocations, pricing, distribution prospects, leverage, and finally conclude with our opinion on which one of them offers the most attractive balance of risks versus rewards for income-focused investors.
Overview:
PIMCO is a fixed income investment manager with assets under management of over $1.88 trillion. Headquartered at Newport Beach, the company manages over 400 mutual funds out of which 21 are closed-ended funds. This report focuses on PFL, PHK and PCI, closed-ended funds of the company. Below is a sector breakdown of the three funds:

Source: PIMCO
Dynamic Credit and Mortgage Income Fund (PCI): This fund was constituted in 2013. The fund is focused on mortgage-related securities and other debt instruments. Generating current income is the primary objective of this fund. 66% of the market value of the assets is invested in mortgages and high yield credit.
Income Strategy Fund (PFL): This fund was constituted in 2003. PFL is focused on the generation of high current income through investments in diversified assets including fixed and floating rate instruments as well as both investment-grade and speculative-grade securities. 50% of the market value of the assets is invested in mortgages and high yield credit.
High Income Fund (PHK): This fund was constituted in 2003. PHK is primarily focused on generating high current income and capital appreciation is a secondary objective. The fund has no upper limits on investing in speculative-grade bonds. 47% of the market value of the assets is invested in mortgages and high yield credit.
What are the advantages of investing in CEFs?
Closed-end funds raise capital through IPO by issuing a limited number of shares which are then traded on the stock exchange. The funds so raised are used to purchase various assets based on the style and objectives of the fund as stated in the prospectus. As the shares are traded in the secondary market, CEFs often trade at a premium or discount to their NAVs. The advantages of CEFs are:
Unlike open-ended funds, closed-ended funds enjoy capital stability as the number of shares offered in the IPO is fixed and the seller can sell the shares only to a willing buyer. In open-ended funds, the market demand can lead to expansion or contraction of the capital available to invest.
Closed-ended funds are allowed to take on more leverage in order to buy assets and generate more return for their shareholders.
PIMCO’s CEFs have consistently outperformed CEF Multi-Sector sector and trade at a premium to NAV
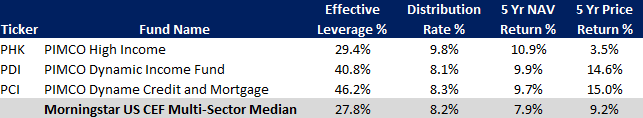
As evident in the chart below, the three PIMCO funds have outperformed the industry on a 5 year and 3-year basis when it comes to NAV returns as well as the distribution rate has been around 10% on average. As a result of superior performance and high income, the company’s CEFs from time to time have traded at a premium.
Source: CEF Connect
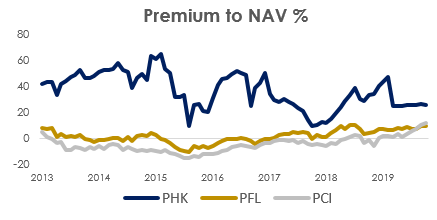
PHK owing to its high dividend distribution has traded at a substantial premium to its NAV in the past but the reasons are less obvious now
The three funds have been a source of high dividend income and have consistently yielded between 8 to 12%. PHK has consistently provided a higher dividend yield due to its higher distribution rate % as compared to that of PCI and PFL. Not surprisingly, PHK has traded at a significant premium to its NAV as investors gravitated towards its higher current income potential that was not captured by its NAV alone. In April 2019, PHK cut its dividend by 25% which led to its premium to NAV to fall from 47% to 24.5%. Further, it is important to note that as a result of the dividend cut, the gap between the dividend yield of PHK and PFL/PCI has narrowed to a multi-year low. However, at the same time, PHK still trades at a premium to NAV of 25% as compared to PCI’s 11.3% and PFL’s 8.5%. We believe the premium to NAV spread could narrow further following the less differentiated dividend yield spread between the CEFs.

Source: Blue Harbinger Research
PCI: A stand out in terms of risk-reward
An analysis of the total returns and the associated volatility of the three CEFs reveals that PCI has been a clear outperformer earning 15% annualized 5 year return with 9% annualized standard deviation (risk). These metrics compare very favorably to PFL’s 9% return and 10% standard deviation and PHK’s 3% return and 21% standard deviation. While PHK’s returns have been penalized by recent distribution cut, adjusting for the cut, it still underperforms as PHK’s premium used to be in the mid 50s in 2013 as compared to the mid-20s premium to NAV now.

Source: Blue Harbinger Research
PCI’s mortgage backed securities portfolio is well positioned
Out of the three CEFs, PCI has the highest exposure to mortgage debt, most of it through exposure to non-agency backed mortgage securities. Non-agency MBSs do not have any explicit or implicit government backing. While the industry saw major dislocation in the great recession, it has been significantly restructured with pre-recession securities becoming a much smaller part of securities outstanding and newer securities being backed by loans that are of better quality with sound terms. As a result of improvement in the economy, delinquency rate on Single-Family Residential Mortgages has reduced from over 10% at the height of the recession to 2.5% in the most recent quarter. Finally, due to the presence of credit risk in non-agency MBSs, yields are attractive and there is more opportunity for alpha generation.
PCI’s high dividend coverage leads to conviction
Out of the three CEFs being reviewed in this report, only PCI has seen its distributions per share increase while PHK has seen consistent declines. Additionally, only PCI is earning more than it is paying out in distributions. PFL and PHK’s 6-month rolling distribution coverage ratio has averaged 72% and 86% over the last few months as compared to 118% at PCI. Distribution coverage of over 100% in PCI provides us visibility with respect to the sustainability of its dividend.
Risks
Over-indexation to non-agency MBS creates concentration risk. PCI has 63% of its assets in non-agency MBS and therefore if there were to be another dislocation in the space, PCI could see a disproportionate impact. Having said that, the industry has gone through a significant restructuring since 2008/09 and asset quality behind the mortgage backed securities has improved considerably over the years, thereby lowering the risk of another major solvency event.
Conclusion: PCI is the best bet among the three
PCI offers the best risk adjusted returns to investors as evidenced by stability and growth in its dividends, superior dividend coverage and higher returns per unit of risk as compared to PFL and PHK. Despite a lower distribution rate of 9.1% as a percentage of market price as compared to PFL’s 9.3% and PHK’s 12.7%, the consistency, stability and safety of distributions at PCI leads us to our positive opinion on the name.