

There are lots of ways to earn big yield in this market, and the BDC space (business development companies) is ripe with opportunities. And while BDCs come in a wide variety of shapes and sizes (data is shared in this report), one that stands out is Trinity Capital (TRIN) because of its growth-sector niche (arguably better aligned with the “new” US economy), internal management team (less conflicts of interest) and outstanding 14% dividend yield. This report reviews all of that, plus the big risks Trintiy currently faces, and then concludes with my strong opinion on investing.
Overview:
Trinity Capital provides diversified financial solutions to growth-stage companies (i.e. mainly loans, equipment financing and “equity & warrants”), and it operates as an internally managed BDC.

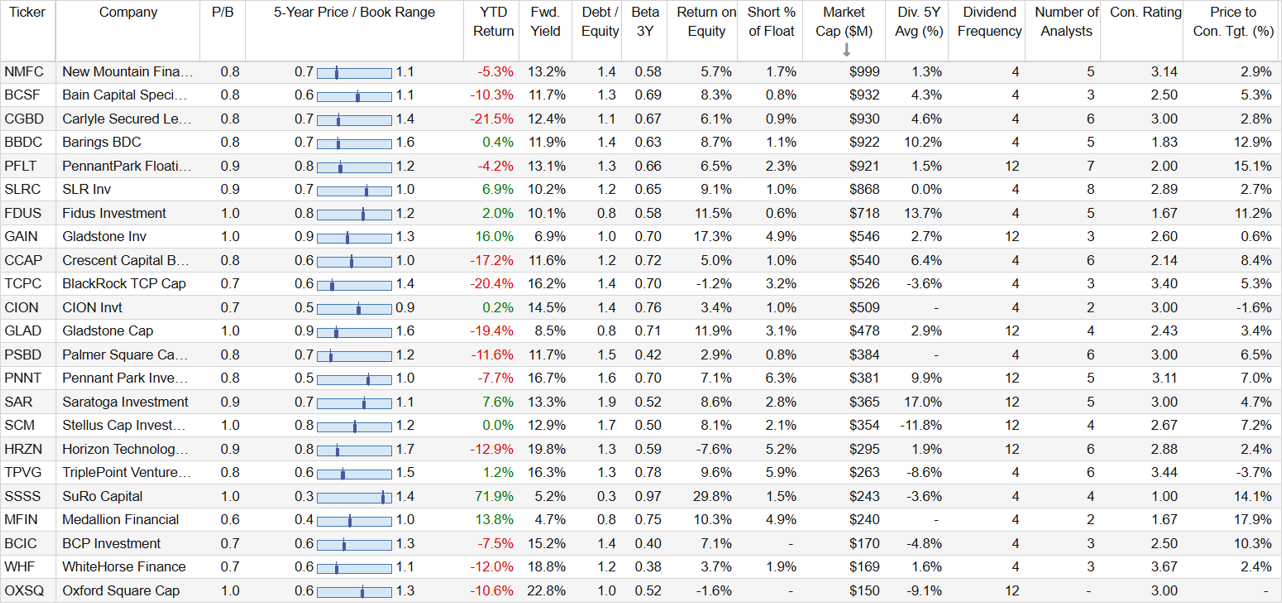
For some background, BDCs were formed by an act of Congress in 1980 to help small (middle market) businesses access capital. As such, BDCs are not taxed at the corporate level as long as they pay out at least 90% of their earnings as dividends. And this is basically the reason so many income-focused investors love BDCs (i.e. the big dividend yields, as you can see in the following table).
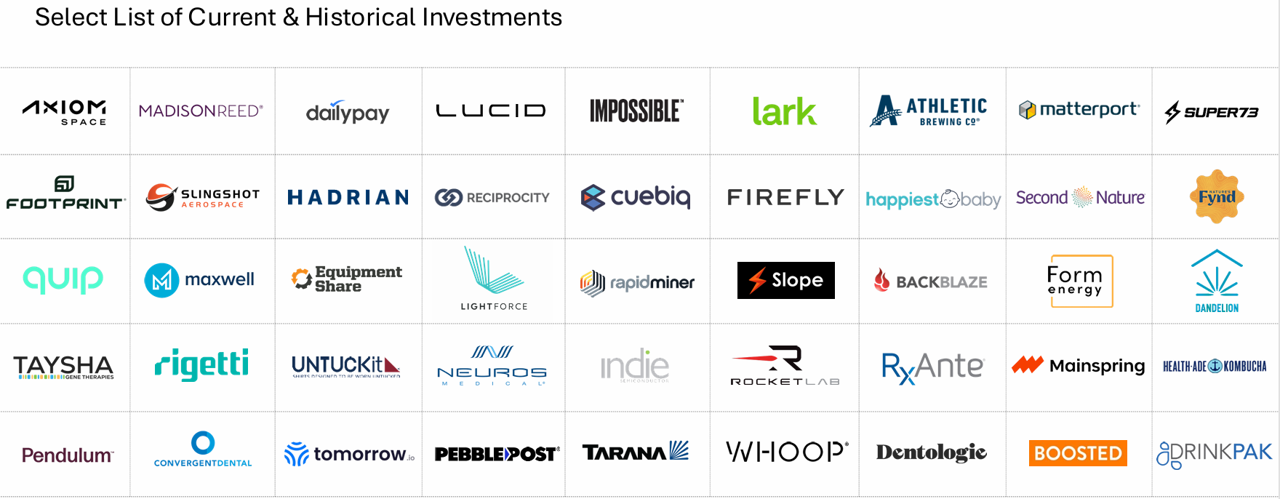
And what makes Trinity unique in the BDC space is its focus on innovative technology (such as AI, software and space technologies—as you can see in the earlier graphic) as well as disruptive healthcare sectors of the economy. This separates Trinity from other BDCs (who are often more focused on older economic sectors) and it has also allowed Trinity to post some relatively impressive total returns (dividends—as if they were reinvested—plus price gains) in recent years as compared to other BDCs. You can see a sample of Trinity investment examples in the graphic below.
Also worth mentioning, Trinity is often granted warrants (the right to buy equity at attractive prices in the future) as part of the financing arrangements they provide to these companies; this can serve both parties well (i.e. the company, because they don’t have to immediately give away a dilutive ownership stake in their business, and Trinity because they get some attractive equity upside too—in addition to the attractive rates they are earnings on the loans they provide—as you can see in the graphic below—this is a big part of how they are able to pay investors such a big quarterly dividend yield).

(2) Effective yield includes fees and accelerated income from prepayments but excludes fees earned from Senior Credit Corp 2022 LLC and is calculated based on the daily weighted average debt investments at cost. (3) Core yield excludes fees and accelerated income from prepayments
Strong Financial in a Challenging Market
Despite headwinds for BDCs in general (such as economic slowdowns and easing rates—more on this in the risks section of this report), the current market environment has been strong for Trinity. For example, Trinity originated a record $773 million in Q3 commitments, thereby pushing their year-to-date total over $1.3 billion.
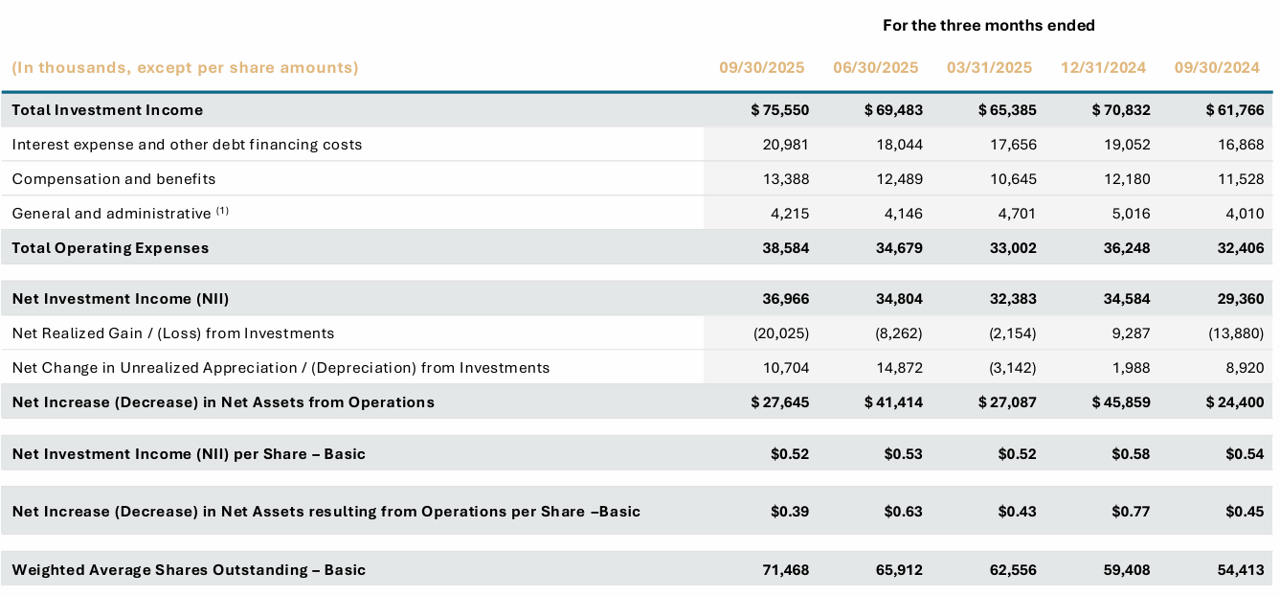
Further, total investment income climbed 22.3% year-over-year to $75.6 million, with NII up 29% to $37 million ($0.52/share—which exceeds the $0.51 cent quarterly dividend).
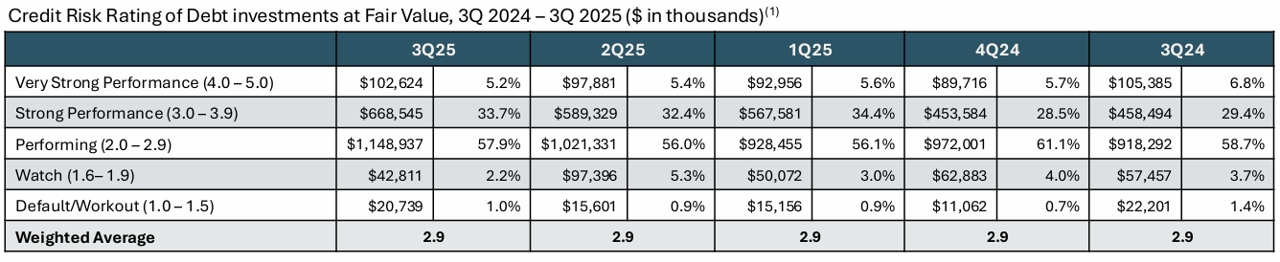
Additionally, Trinity is demonstrating prudent credit quality (the BDC maintains an investment grade credit rating) in a risky landscape. For example, Trinity's weighted-average risk rating (its own internal metric) held steady at 2.9 (on a 1-5 scale) through Q3 (reflecting continued discipline in underwriting standards—amid modest sector-wide non-accrual increases). This resilience counters 2025's credit crunch, where other leveraged borrowers have been strained under persistent high rates).
And for a little more perspective, you can see the non-accrual percentages (basically the percent of loans not paying as per their loan terms—i.e. technical default) along with various other important BDCs metrics across the industry (i.e. peers and competitors of Trinity) in the following table (lots of good data here).
Dividend Safety
As mentioned, Trinity’s net investment income continues to cover its quarterly dividend payments to shareholders (a good thing), but it also has a growing history of steady dividend increases (as you can see in the chart below).
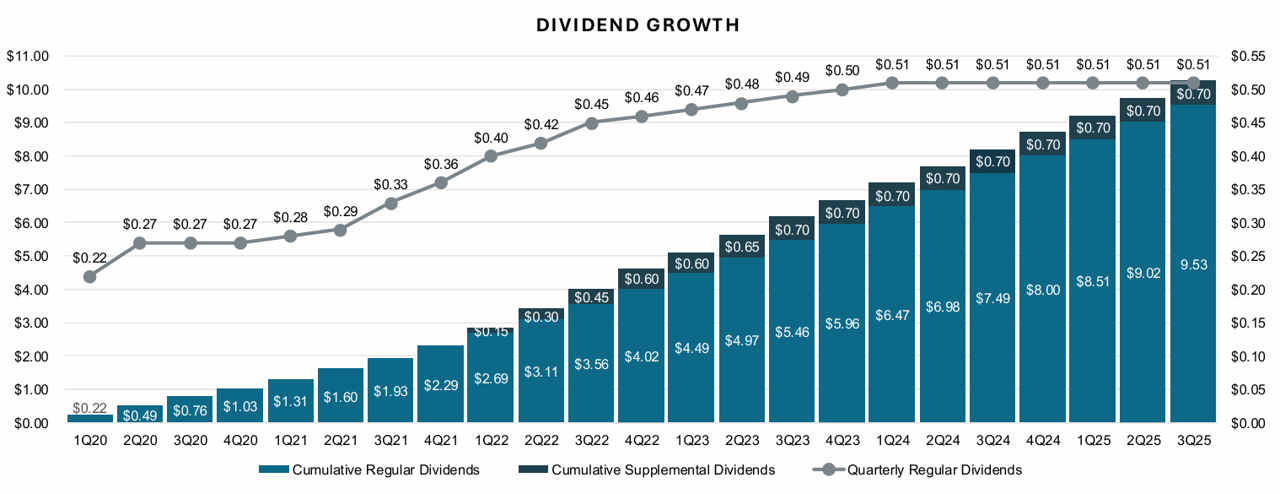
Just because a company is increasing its dividend, that is not necessarily a good thing. However, Trinity has been increasing its net asset value (see chart below) and its net investment income too, which does lend support to the attractiveness of this big-dividend BDC.
Valuation:
Currently trading at approximately 1.1x book value, Trinity is fairly reasonably priced compared to its own history (see earlier BDC table for range) and peers, especially considering the aggregate BDC book value keeps growing (while book value per share is also trending slightly higher).

And the eight Wall Street analysts covering Trinity rate it a “Buy” (with a 1.89 aggregate rating, and 10.4% share priced upside) as you can see in our earlier BDC comparison table.
Trinity Risks:
However, Trinity also faces risks investors should consider. For example, primary concerns include:
Interest Rates are a risk factor investors need to consider. In particular, Trinity has an 82.4% floating rate debt investment portfolio and a 40.6% floating rate borrowing portfolio (as of September 30, 2025. And with uncertainty surrounding the rate (and even direction) of upcoming Fed interest rate moves, Trinity as at risk, as you can see in the following graphic.
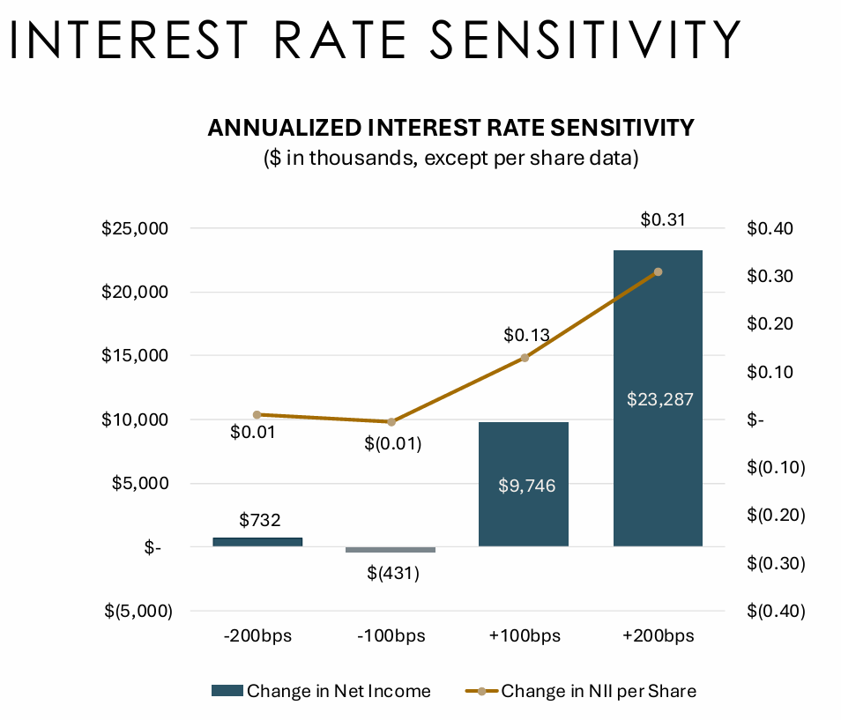
Anticipated Fed cuts could pressure lending spreads and erode net investment income as BDCs refinance (likely at lower yields). You can see the percent floating versus fixed rates for most BDCs in our earlier table.
Credit defaults pose another threat. And while Trinity's non-accruals are low (as described earlier), broader private credit turmoil—from bankruptcies to tariff-impacted sectors—could hit its venture-backed holdings, especially with Trinity’s high payout ratio (i.e. limited buffer).
Concentrated Growth Sector Exposure: With its concentration in growth and technology sectors, Trinity has been benefiting from the same “Growth/AI Bubble” that has many investors concerned. Even though Trinity is largely a debt investor, the BDC will still face pressures if/when the market cycle turns against growth and technology. For example, when the “Covid Bubble” burst in late 2021/2022, Trinity sold of hard as you can see in the following chart.

However and arguably, if the fed plays its monetary policy cards right (with rate cuts), Trinity may not suffer the same fate (lower rates are good all sectors of the economy, especially growth and technology).
The Bottom Line
Whereas a lot of other BDCs focus on “old” economic sectors, Trinity’s niche focus on growthier and technology sectors gives its investors differentiated big-yield exposure. Not only is the outsized dividend yield attractive, but it’s generated from “newer” parts of the economy—arguably providing significantly more long-term growth potential.
However, the differentiated high income also comes with risks, including potential pain when the current growth-sector rally sells off (potentially significantly harder than more-value-focused BDCs) as we saw for Trinity when the covid-growth-bubble burst in 2021-2022 (see Trinity’s share price performance above).
Overall, I view Trinity as an attractive big-yield BDC that is absolutely worth considering. I own it (in my prudently diversified, long-term, income-focused portfolio).
In fact, I have ranked Trinity Capital at #7b in my latest report: Top 10 Big Yields: BDCs, CEFs and Dividend Stocks.