
Here is a 10,000 foot view of what’s been going on in the the market this year versus the last five years (including select sector, industry and investment style performance), plus the 10 best and 10 worst performers (year-to-date) in the S&P 100. It can be helpful to step back for a moment to consider some high-level perspective and insights.

One of the first things you may notice is that the 10 best performing stocks this year are largely energy stocks (energy prices are way up), and the 10 worst performers are largely “high growth” stocks (as the Fed’s inflation-fighting interest rate hikes have been especially detrimental to the performance of high-growth stocks).
A similar pattern emerges when considering sector, industry and style performance, below.
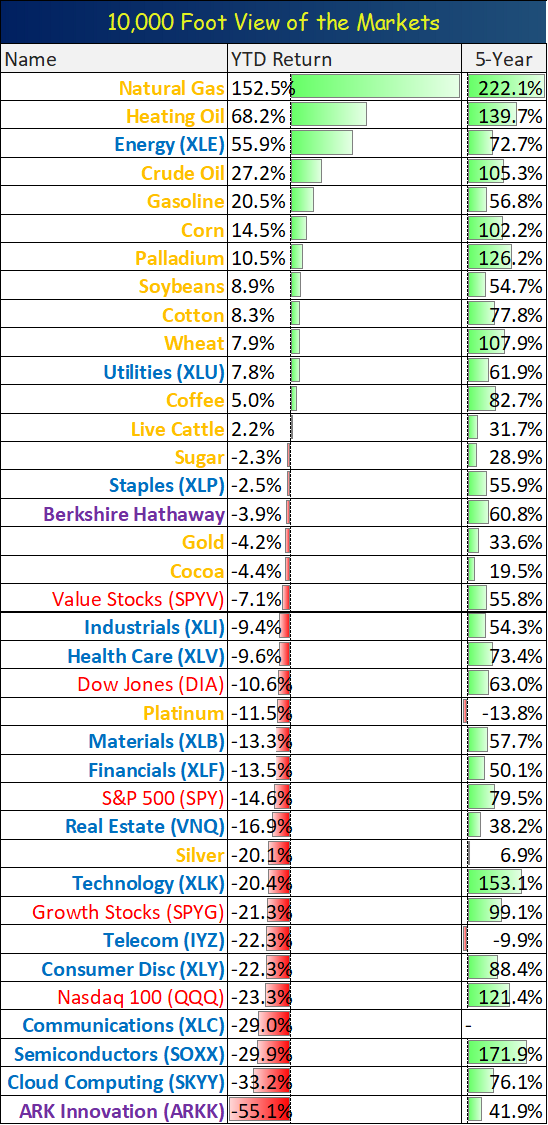
However, a step back to consider the 5-year performance column can be helpful. First, you’ll see even the infamous ARK Innovation ETF (ARKK), the poster child for pandemic-style growth stocks, is the worst-performer this year (among our select group), but it is still up 41.9% over the last 5 years. And quite honestly, that is not a bad 5-year return at all. More importantly, it should be a reminder to investors that (despite all the hate that fund is getting this year), stocks are a long-term strategy (really at least 5 to 10 years), and stocks are still doing well over the last 5 years (even the “growthiest” stocks, which are currently among the most out-of-favor among investors).
Also, the S&P 500 is down 14.6% this year, but still up nearly 80% over the last 5-years—that is fantastic. Further, Warren Buffett’s Berkshire Hathaway (BRK) is beating the S&P 500, and it has made up a lot of ground this year (considering it is still underperforming the S&P 500 over the last 5 years.
And of course the best performers this year—and over the last five years—are mostly commodities. Critical to keep in mind, commodities can have extremely good periods (like this year, when inflation is sky high) and extremely bad periods (when they go out of favor), but over the very long-term (i.e. 100 years) they’re basically just an inflation hedge and have returned around 2.5% per year, roughly the same rate as inflation. Critically important, even if you think inflation will continue to be a problem in the coming months and years—it’s probably not a good long-term decision to dump your entire nest egg into commodities. Actually, that would probably be a terrible idea considering (unlike actually businesses/stocks) commodities generate no income, pay no dividends and are only worth whatever the current market rate will allow (which can be volatile in both directions).
Takeaway:
If you have been following the market closely this year, you may be acutely aware of what is going on in the short run (i.e. the market sold off hard in the first half of the year, followed by strong gains (recouping just a portion of the year-to-date losses), but now selling off hard again in recent sessions).
There are a lot of people that will tell you they can predict the short-term market moves, but the reality is they cannot (frankly, they are either dishonest of confused).
At the end of the day, disciplined long-term investing, in businesses that can generate a lot of profits (while also creating at least some value for society) has proven to be a winning strategy over and over again. It can make sense (depending on your goals) to stay prudently diversified across many of the different sectors and styles (described earlier) to help mute at least some of the short-term volatility. But don’t go dumping all your assets into something just because it has been working lately. Be smart, stay focused on your long-term goals.
Note: we are long shares of Exxon Mobil (XOM) (the top S&P 100 stock this year) in our prudently-diversified and goal-focused Income Equity Portfolio (which is up this year while the overall market is down).