
There are as many prudent dividend strategies as there are dividend investors. However, in this report, we review three specific income-focused portfolio strategies, including: (1) monster big yields, (2) dividend growth investing, and (3) build-your-own income (we’ll explain). Next, we dive into the details on two monster big-yield closed-end funds (“CEFs”) from PIMCO, including the Dynamic Income Fund (PDI) and the Dynamic Income Opportunities Fund (PDO). After comparing these two funds in detail (including the 7 things we always consider when evaluating CEFs) we conclude with our strong opinion on which one is better, and how they fit (or do not fit) into our prudently diversified (e.g. CEFs, BDCs, REITs and more) High Income NOW portfolio (28-positions, 10.2% aggregate yield, much of it paid monthly).

1. Monster Big Yields:
For purposes of this report, a “monster big yield” is any investment that yields 9% to 10% or more. Yields this high immediately raise red flags for many investors (and rightfully so) because such high yields can be an indication of risk or a company in distress. However, when selected correctly, monster big yields can be 100% prudent and exactly what many investors want and need.
To be clear, over the long-term, many monster big-yields will NOT dramatically outperform the S&P 500. And that is totally fine for some investors. After all, a lot of income-focused investors simply have the goal of receiving big steady income from their investments. And in this case, monster big-yields can be a very beautiful thing. We’ll get into two specific examples of monster big yields later in this report (i.e. PDO and PDI).
2. Dividend Growth Investing
While both groups are focused on income, “dividend growth” investors and “monster big-yield” investors can be diametrically opposed to each other. And this isn’t because one group is right and the other group is wrong. Rather, it’s because they have different goals.
Dividend growth investing is a very special strategy that serves many investors brilliantly because (when done correctly) it can provide steady growing income, relatively low volatility price gains, and attractive total returns (i.e. price gains plus dividends reinvested) that at least keep pace with the overall market (such as the S&P 500). However, compared to monster big yields, dividend growth stocks generally offer current yields that are lower (for example, less than 1% to over 4%).
One of my all-time favorite dividend growth stocks is Microsoft (MSFT), a company that has raised its dividend for 18 years in a row). A lot of investors roll their eyes at the idea of Microsoft being a dividend stock because its current yield is so low (currently only around 0.8%). However, this is where the all important concept of “yield on cost” comes in. For example, here is a look at the long-term dividend growth of Microsoft versus perennial high-yielder AT&T (T). The charts tell a very interesting story, and they show a little bit of the magic of dividend growth investing.
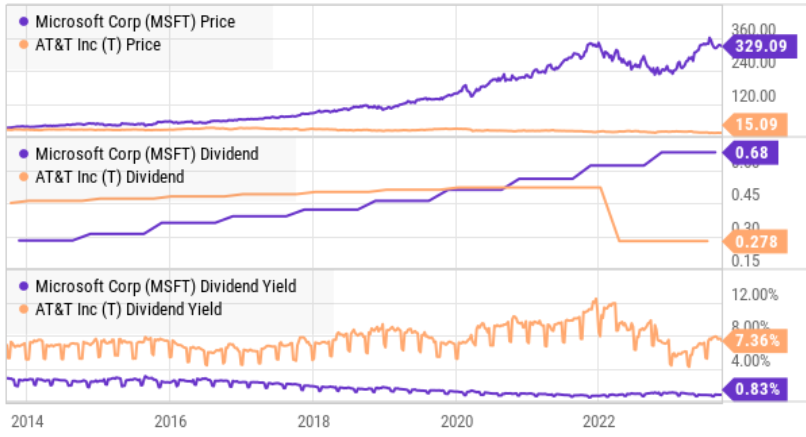
For starters, as you can see above, 10 years ago both Microsoft and AT&T traded at around the same share price. However, AT&T offered a much bigger dividend yield (whereas Microsoft’s business was growing much faster in terms of revenue and net income). And had you decided to “chase” after AT&T just because its yield was bigger, you are likely a sorely disappointed investor 10 years later considering Microsoft’s dividend grew much faster, was never cut, and is now actually much bigger than AT&T’s dividend.
Specifically, if you bought Microsoft and AT&T for around $28 a share one decade ago (in 2013), your “yield on cost” for AT&T is now 3.9% (i.e. the current annual dividend divided by the $28 share price in 2013), whereas your yield on cost for Microsoft is an impressive 9.7%. Further still, the total return (share price gains plus dividends reinvested) for AT&T over the last decade is 22.8%, whereas the total return for Microsoft is more than 1100%. That is one example of the power of dividend growth investing!
3. Build Your Own Income
Lastly, “build-your-own income” investing takes on a lot of forms, but it is basically where you use a combination of dividends and share price gains to generate whatever income you need for spending cash. On one hand, this is an absolutely terrible strategy for some investors because it requires constantly selling some shares (to recognize gains that you can use for spending cash), dealing with capital gains and ordinary dividend income taxes, and of course the pains of market volatility (who wants to sell shares to generate income when market prices are temporarily low due to volatility). On the other hand, the build-your-own income strategy tends to work better for longer-term investors who may have lower current income needs and are less stressed by market volatility.
Interestingly, the build-your-own income strategy is exactly what popular PIMCO CEFs PDO and PDI do. Specifically, the fund managers use a combination of dividends, interest payments, price gains and even a return of capital (“ROC”) to generate the monster big yields that so many investors love receiving every month (as we will see in the next section).
PDO vs PDI: 2 Monster Big Yields, Compared
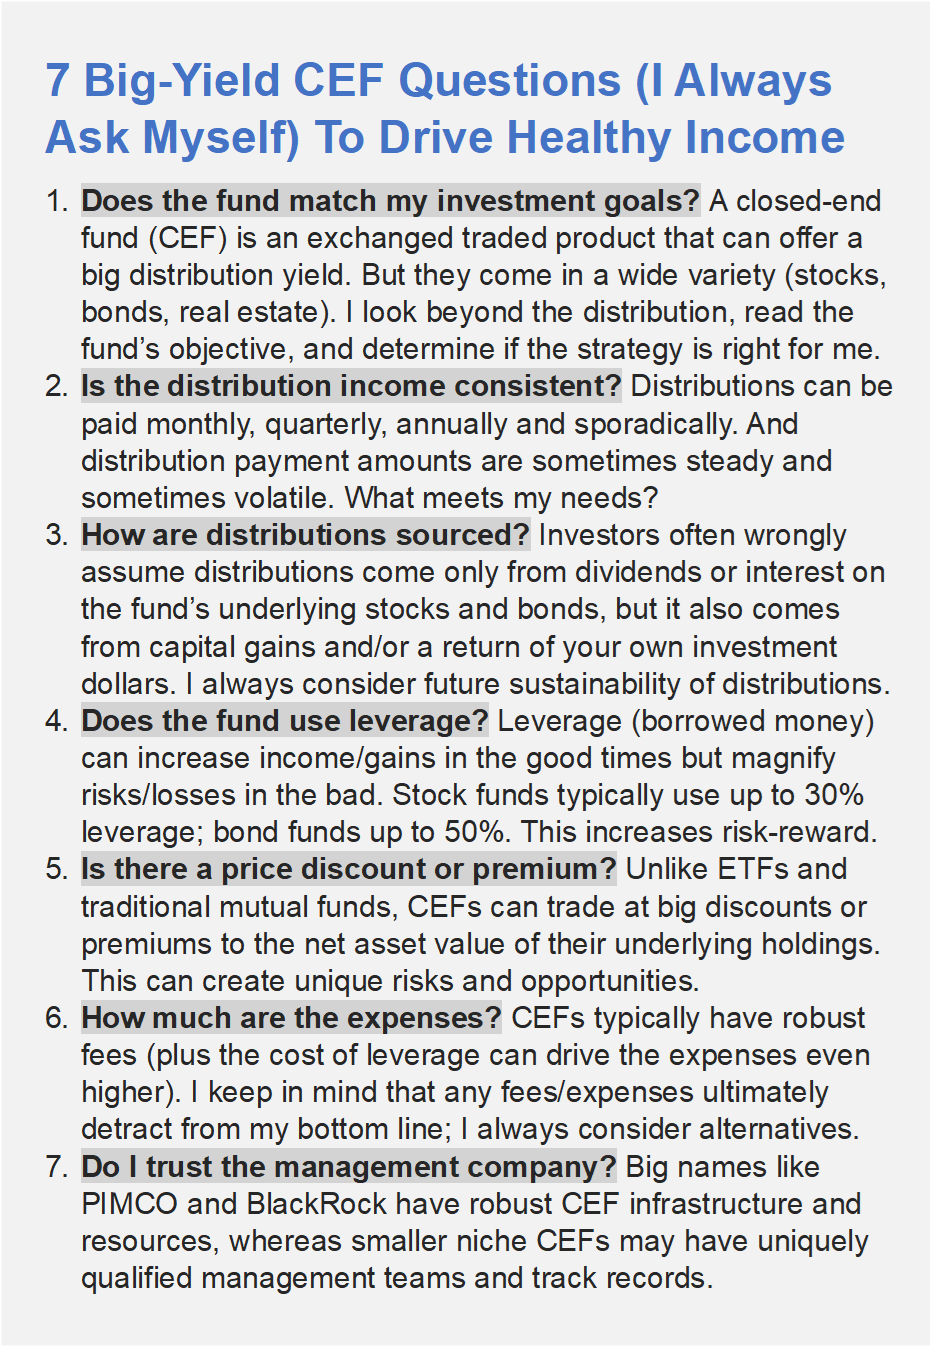
PDO and PDI are often income investor favorites thanks to their big steady monthly income payments. However, past performance is no guarantee of future success. Let’s take a closer look at these two popular monster yields through the lens of 7 CEFs questions we always ask before investing.
1. The Objectives of the two funds (PDI and PDO) are identical. Specifically, per the fund webpages, the objective of both funds is as follows:
Seeks current income as a primary objective and capital appreciation as a secondary objective
Furthermore, the funds are very similar in terms of sector allocations. Specifically, they both hold a mix of mortgage-backed securities, high yield credit and non-US developed market credit (and in similar weightings). They also have similar interest rate risk, as measured by duration, with PDO at 3.37 years and PDI at 3.31 years. The three main differences are (1) the number of holdings (PDO holds around 400 positions and PDI holds over 1,400), (2) the assets in each fund (both are very large with PDO at around $1.4 billion and PDI at around $4.6 billion), and (3) the inception dates (PDO was launched in 2021 whereas PDI has been around since 2012.
2. The Distributions have been consistent, so far. Specifically, both funds have paid steady (sometimes increasing) monthly income, and both occasionally pay additional special distributions too. Neither fund has ever reduced its distribution. PDO currently yields around 12.8% and PDI yields around 15.1%. This big steady income is the main reason so many investors have come to love these funds. However, keep in mind that past distribution performance is no guarantee of future success (more on this later).
3. The Distribution Sources have been mixed. For example, CEFs can fund their distributions with a combination of interest payments (on the underlying bond holdings), capital gains (long-term or short term) or through a return of capital (“ROC”). And as you can see in the table below (i.e. the latest undistributed net investment income reports) neither PDI or PDO have been able to cover their recent distributions with investment income. Said differently, they’ve been paying out more than they have been earning, thereby resulting in the estimated ROC you see in the table below.
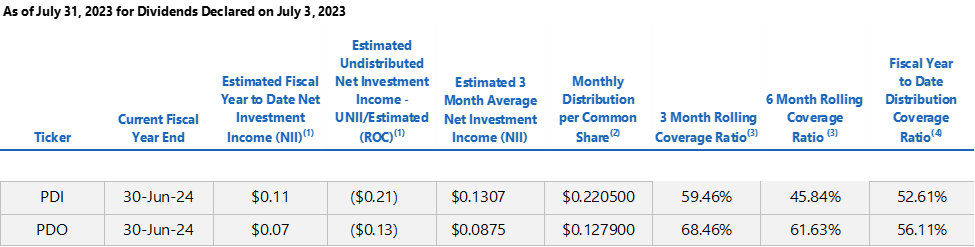
ROC can be a very negative thing because it reduces the net asset value of the fund and thereby reduces the fund’s future earnings potential. And in the case of PDI, the ROC has been even worse than PDO. In fact, PDI’s coverage ratios are arguably downright ugly.
Some investors wrongly believe PDI has never had any ROC (because they assume sources like CEF Connect are correct when they are not). For example, here is a link to PDI’s recent 19a notice demonstrating ROC is a regular occurrence for the fund (these notices are also available on the fund’s website here).
For some perspective, the funds (PDI and PDO) got into trouble when the fed started abruptly (and sharply) raising interest rates over the last two years (rising rates make bond prices fall). And compounding the challenges of rising rates, has been the high level of leverage these funds use.
4. Leverage is used by both funds. Specifically, PDI recently had 43.4% leverage and PDO had 46.7%. As mentioned, leverage can magnify income and returns in the good times, but cause magnified losses in the bad times (such as when interest rates are rising like that have been over the last two years). For many years, the high leverage ratios of used by PIMCO bond funds (higher than many peers) has been manageable and helped improve returns. But in recent years, the high leverage has magnified challenges and losses. And that is why these funds have posted some pretty ugly total returns lately, as you can see in the chart below.
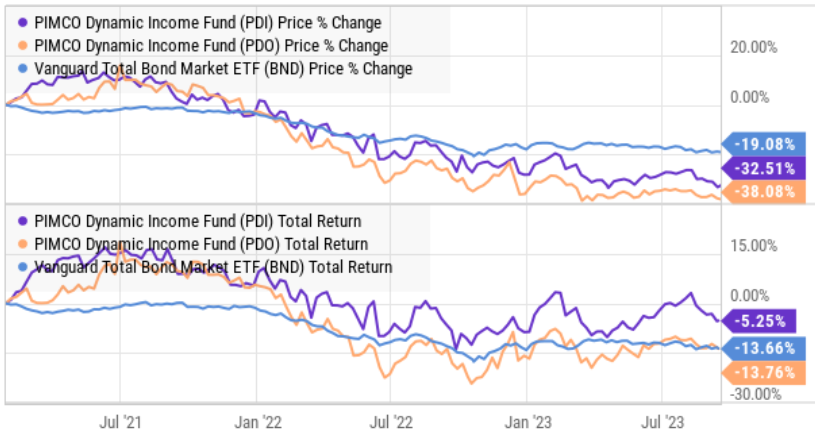
Also worth mentioning, as interest rates rise, the cost of leverage (borrowing) also goes up.
5. A Small Premium to NAV exists for both funds. Specifically, PDO trades at a 2.1% premium to NAV and PDI trades at a 4.3% premium to NAV. These are relatively small premiums for PIMCO funds, and relatively small premiums for these funds in particular (as compared to history). However, the premium means when you buy one of these funds, you are paying more than the aggregate value of everything it owns (i.e. all the bonds these funds own in aggregate are worth less than the price per share of the funds).
6. Expenses are very large for both funds. For example, the total expense ratio for PDO is 5.75% and for PDI it 5.12%. To some investors, an expense ratio this high is absurdly unacceptable, but for others it is totally acceptable as long as those big steady income payments keep rolling in. Recognize also that the total expense ratio consists of management fees, operational expenses and leverage (i.e. the cost of borrowing which is on the rise as interest rates go up). And PDO’s expense ratio is higher in part because it is smaller and benefits from less economies of scale as compared to the larger PDI.
7. The management teams at PIMCO are highly competent. Specifically, PIMCO is the premier bond CEF manager in the world, and the funds have access to ample resources and skill sets to effectively manage according to their objectives. Some investors argue that PIMCO could do a better job disclosing the ROC to investors, but the information is available on the website if you read the fine print.
Interest Rate Risk:
A final critical point on both PDI and PDO is their interest rate risk. As mentioned earlier, their 3-4 year duration (a measure of interest rate risk) suggests that if rates keep rising, these bond funds will keep falling in value. However, based on the latest inflation numbers (i.e. inflation has slowed) the fed has paused interest rate hikes. This is a good thing for the NAV of these funds. Specifically, it suggests the earnings (distribution) power of these funds may be stabilizing, and investors can focus more on those big steady income payments, and less on price volatility concerns.
Of course, no one really knows where interest rates are headed next, but many investors (including CME fed fund futures) are suggesting that rates could even decline in 2024. If interest rates fall, the NAV of these funds will rise (all else equal) and that is a very good thing for investors.
So while many investors are focused on the ugly recent performance of these funds (over the last two years, as rates were rising), past performance is not an indication of future performance. And if rates fall, both of these funds can rise in price and keep paying those big steady monthly distributions (that so many income-focused investors love).
Conclusion:
We currently own shares of both PDI and PDO. However, we recently reduced our exposure to PDI as the very large distribution yield seems to be becoming increasingly unsustainable (as evidenced by the low coverage ratios) and a distribution reduction could be on the horizon in the quarters ahead. This is why we own an attractive mix of big-yield CEFs, BDCs, REITs and more in our “monster yield” High Income NOW portfolio (it currently yields 10.2%).
And technically, we also own shares of Microsoft in our Income Equity Portfolio (which focuses more on dividend growth investing). And of course, we even own shares of zero-dividend growth stocks in our Disciplined Growth Portfolio.
Most importantly, at the end of the day, you need to select a strategy and build an investment portfolio that meets your own individual goals and situation. We believe strongly that disciplined goal-focused investing will continue to be a winning strategy.